
- Home >
- Stock Videos >
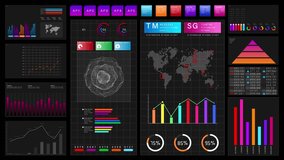
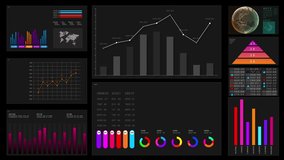
- Animated Data Visualization on Technology Interface
Animated Data Visualization on Technology Interface Video

Contains animated graphical elements depicting statistical data processing on a hi-tech interface with a purple gradient. Pie charts and rectangular scripts contribute to a business and technology-focused presentation, suitable for financial analysis, digital marketing campaigns, or illustrating technological progression. Useful for website headers or application dashboards emphasizing analytical processes.
Powered by  - Get 15% off with code: PIKWIZARD15


downloads
Tags:
More
Credit Photo
If you would like to credit the Photo, here are some ways you can do so
Text Link
video Link
<span class="text-link">
<span>
<a target="_blank" href=https://pikwizard.com/video/animated-data-visualization-on-technology-interface/213b85a0234d854e791c2ce58b6d101e/>PikWizard</a>
</span>
</span>
<span class="image-link">
<span
style="margin: 0 0 20px 0; display: inline-block; vertical-align: middle; width: 100%;"
>
<a
target="_blank"
href="https://pikwizard.com/video/animated-data-visualization-on-technology-interface/213b85a0234d854e791c2ce58b6d101e/"
style="text-decoration: none; font-size: 10px; margin: 0;"
>
<video controls style="width: 100%; margin: 0;">
<source src="https://player.vimeo.com/progressive_redirect/playback/879079858/rendition/360p/file.mp4?loc=external&oauth2_token_id=1223210874&signature=503e9ac116133039e64ef0b3705ebdcfb5c10966a63a71ad373a3c044129b20b" type="video/mp4"
poster="https://pikwizard.com/pw/medium/213b85a0234d854e791c2ce58b6d101e.jpg"/>
Your browser does not support the video tag.
</video>
<p style="font-size: 12px; margin: 0;">PikWizard</p>
</a>
</span>
</span>
Free (free of charge)
Free for personal and commercial use.
Author: Awesome Content