
- Home >
- Stock Videos >
- Animated Data Visualization Report Analysis Chart with Bars
Animated Data Visualization Report Analysis Chart with Bars Video
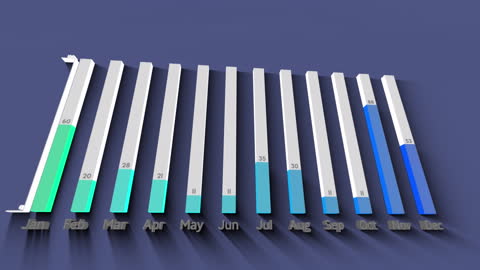
Animation depicts monthly data in vertical bar graph format on a violet background. Useful for illustrating changes in data over time, perfect for business presentations, financial reports, educational purposes in explaining economic concepts, or any content requiring clear visual representation of metrics.
Powered by  - Get 15% off with code: PIKWIZARD15


downloads
Tags:
More
Credit Photo
If you would like to credit the Photo, here are some ways you can do so
Text Link
video Link
<span class="text-link">
<span>
<a target="_blank" href=https://pikwizard.com/video/animated-data-visualization-report-analysis-chart-with-bars/0cdf85370642460231b69fa1880cef07/>PikWizard</a>
</span>
</span>
<span class="image-link">
<span
style="margin: 0 0 20px 0; display: inline-block; vertical-align: middle; width: 100%;"
>
<a
target="_blank"
href="https://pikwizard.com/video/animated-data-visualization-report-analysis-chart-with-bars/0cdf85370642460231b69fa1880cef07/"
style="text-decoration: none; font-size: 10px; margin: 0;"
>
<video controls style="width: 100%; margin: 0;">
<source src="https://player.vimeo.com/progressive_redirect/playback/728194409/rendition/240p/file.mp4?loc=external&oauth2_token_id=1223210874&signature=b8a0f5396433c702caa59c2a9691d4341cd33d632846173da9cc931cc3c7cd95" type="video/mp4"
poster="https://pikwizard.com/pw/medium/0cdf85370642460231b69fa1880cef07.jpg"/>
Your browser does not support the video tag.
</video>
<p style="font-size: 12px; margin: 0;">PikWizard</p>
</a>
</span>
</span>
Free (free of charge)
Free for personal and commercial use.
Author: Awesome Content