
- Home >
- Stock Videos >
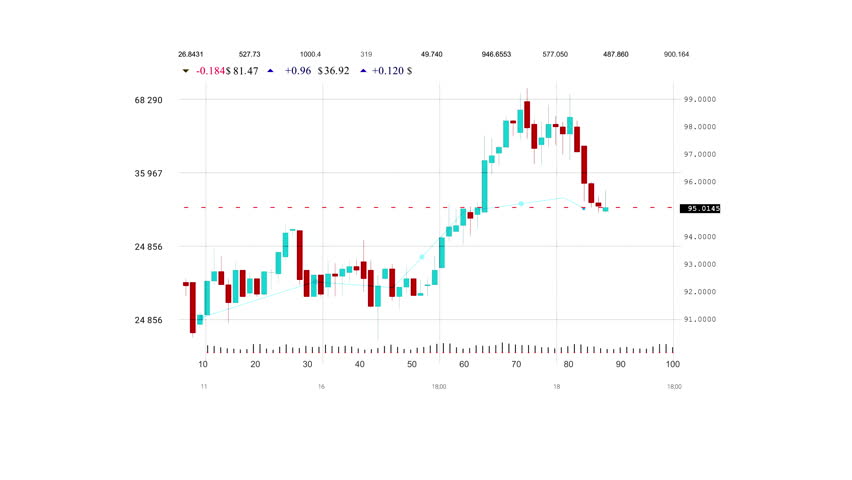
- Animated Financial Chart with Red and Green Candlesticks on Blue Grid
Animated Financial Chart with Red and Green Candlesticks on Blue Grid Video

Graph features animated red and green candlesticks representing stock market data on a blue grid. Useful for illustrating concepts related to finance, trading strategies, and market analysis. Ideal for presentations, educational content, and finance-related projects emphasizing trends or volatility.
Powered by  - Get 15% off with code: PIKWIZARD15


0
downloads
downloads
Tags:
More
Credit Photo
If you would like to credit the Photo, here are some ways you can do so
Text Link
video Link
<span class="text-link">
<span>
<a target="_blank" href=https://pikwizard.com/video/animated-financial-chart-with-red-and-green-candlesticks-on-blue-grid/3aaadeccd5c4b1e31bc8a6f94c613a01/>PikWizard</a>
</span>
</span>
<span class="image-link">
<span
style="margin: 0 0 20px 0; display: inline-block; vertical-align: middle; width: 100%;"
>
<a
target="_blank"
href="https://pikwizard.com/video/animated-financial-chart-with-red-and-green-candlesticks-on-blue-grid/3aaadeccd5c4b1e31bc8a6f94c613a01/"
style="text-decoration: none; font-size: 10px; margin: 0;"
>
<video controls style="width: 100%; margin: 0;">
<source src="https://player.vimeo.com/progressive_redirect/playback/990349869/rendition/240p/file.mp4?loc=external&oauth2_token_id=1223210874&signature=55bcd9eda17602f5f0d1717765a919936d10659f198fda4f9582dfffcfd9a982" type="video/mp4"
poster="https://pikwizard.com/pw/medium/3aaadeccd5c4b1e31bc8a6f94c613a01.jpg"/>
Your browser does not support the video tag.
</video>
<p style="font-size: 12px; margin: 0;">PikWizard</p>
</a>
</span>
</span>
Free (free of charge)
Free for personal and commercial use.
Author: Awesome Content