
- Home >
- Stock Videos >
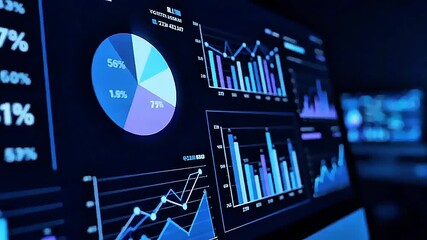
- Animated Financial Charts and Graphs for Data Visualization
Animated Financial Charts and Graphs for Data Visualization Video

Dynamic animation of financial charts and graphs incorporating global data visualization. Useful for presentations, reports, and educational purposes, showcasing modern financial analysis tools and statistical transformations.
Powered by 


downloads
Tags:
More
Credit Photo
If you would like to credit the Photo, here are some ways you can do so
Text Link
video Link
<span class="text-link">
<span>
<a target="_blank" href=https://pikwizard.com/video/animated-financial-charts-and-graphs-for-data-visualization/a04839aa03a3eb5276a4f53391c54915/>PikWizard</a>
</span>
</span>
<span class="image-link">
<span
style="margin: 0 0 20px 0; display: inline-block; vertical-align: middle; width: 100%;"
>
<a
target="_blank"
href="https://pikwizard.com/video/animated-financial-charts-and-graphs-for-data-visualization/a04839aa03a3eb5276a4f53391c54915/"
style="text-decoration: none; font-size: 10px; margin: 0;"
>
<video controls style="width: 100%; margin: 0;">
<source src="https://player.vimeo.com/progressive_redirect/playback/997975533/rendition/240p/file.mp4?loc=external&oauth2_token_id=1223210874&signature=95bf79b1309f812240bea09f03f22d6d0f331f39a3e7bf83d02414ed3fc94d1e" type="video/mp4"
poster="https://pikwizard.com/pw/medium/a04839aa03a3eb5276a4f53391c54915.jpg"/>
Your browser does not support the video tag.
</video>
<p style="font-size: 12px; margin: 0;">PikWizard</p>
</a>
</span>
</span>
Free (free of charge)
Free for personal and commercial use.
Author: Awesome Content