
- Home >
- Stock Videos >
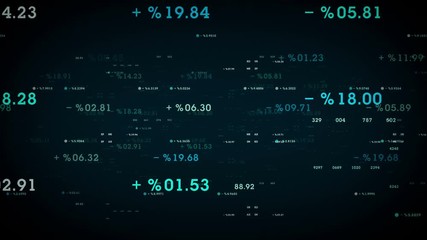
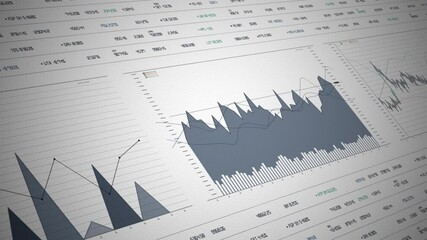
- Animated Financial Data Analysis with Mathematical Equations
Animated Financial Data Analysis with Mathematical Equations Video

This visual conceptualizes the integration of financial data analysis with mathematical equations, depicting data graphs overlaying a backdrop of complex formulas. Suitable for use in presentations related to finance, data analytics, technology innovations, or educational content on economic strategies and stock market dynamics.
Powered by 


downloads
Tags:
More
Credit Photo
If you would like to credit the Photo, here are some ways you can do so
Text Link
video Link
<span class="text-link">
<span>
<a target="_blank" href=https://pikwizard.com/video/animated-financial-data-analysis-with-mathematical-equations/f8064b2224fccac468423a7892ee609d/>PikWizard</a>
</span>
</span>
<span class="image-link">
<span
style="margin: 0 0 20px 0; display: inline-block; vertical-align: middle; width: 100%;"
>
<a
target="_blank"
href="https://pikwizard.com/video/animated-financial-data-analysis-with-mathematical-equations/f8064b2224fccac468423a7892ee609d/"
style="text-decoration: none; font-size: 10px; margin: 0;"
>
<video controls style="width: 100%; margin: 0;">
<source src="https://player.vimeo.com/progressive_redirect/playback/790497536/rendition/240p/file.mp4?loc=external&oauth2_token_id=1223210874&signature=3e36529aaf7e5ddfdd5440e147a771e4d12aa3eb1efb4b1e105e4297799dff75" type="video/mp4"
poster="https://pikwizard.com/pw/medium/f8064b2224fccac468423a7892ee609d.jpg"/>
Your browser does not support the video tag.
</video>
<p style="font-size: 12px; margin: 0;">PikWizard</p>
</a>
</span>
</span>
Free (free of charge)
Free for personal and commercial use.
Author: Awesome Content