
- Home >
- Stock Videos >
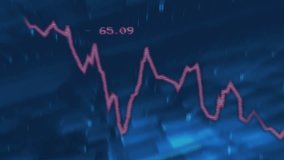
- Animated Financial Data and Statistical Processing over Grid
Animated Financial Data and Statistical Processing over Grid Video

Animation showcases shifting statistics and financial data on a grid, symbolizing modern financial analysis and global business trends. Ideal for presentations, financial reports, market analysis videos, and economic research discussions.
Powered by  - Get 15% off with code: PIKWIZARD15


downloads
Tags:
More
Credit Photo
If you would like to credit the Photo, here are some ways you can do so
Text Link
video Link
<span class="text-link">
<span>
<a target="_blank" href=https://pikwizard.com/video/animated-financial-data-and-statistical-processing-over-grid/712ad8149b92662843f83b8a9b38f4df/>PikWizard</a>
</span>
</span>
<span class="image-link">
<span
style="margin: 0 0 20px 0; display: inline-block; vertical-align: middle; width: 100%;"
>
<a
target="_blank"
href="https://pikwizard.com/video/animated-financial-data-and-statistical-processing-over-grid/712ad8149b92662843f83b8a9b38f4df/"
style="text-decoration: none; font-size: 10px; margin: 0;"
>
<video controls style="width: 100%; margin: 0;">
<source src="https://player.vimeo.com/progressive_redirect/playback/790324600/rendition/240p/file.mp4?loc=external&oauth2_token_id=1223210874&signature=10f7769cf778df52e541c6288af6e0f1adba43f62d1efe81ce6e11c464bb6f98" type="video/mp4"
poster="https://pikwizard.com/pw/medium/712ad8149b92662843f83b8a9b38f4df.jpg"/>
Your browser does not support the video tag.
</video>
<p style="font-size: 12px; margin: 0;">PikWizard</p>
</a>
</span>
</span>
Free (free of charge)
Free for personal and commercial use.
Author: Awesome Content