
- Home >
- Stock Videos >
- Animated Financial Data Chart with Dynamic Lines
Animated Financial Data Chart with Dynamic Lines Video
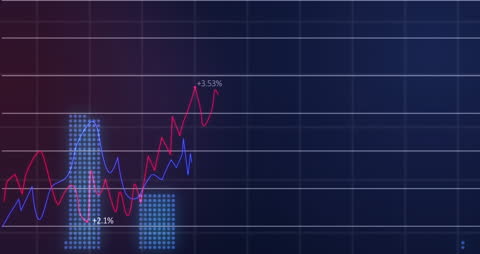
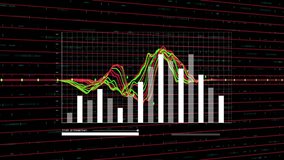
Visual representation of financial data processing featuring dynamic lines on a grid. Useful for presentations on economic trends, business reports, and analytical methods illustrating growth patterns in global finance.
Powered by  - Get 15% off with code: PIKWIZARD15


downloads
Tags:
More
Credit Photo
If you would like to credit the Photo, here are some ways you can do so
Text Link
video Link
<span class="text-link">
<span>
<a target="_blank" href=https://pikwizard.com/video/animated-financial-data-chart-with-dynamic-lines/b05f12b76aeb49bf89c3d4b80f76ec61/>PikWizard</a>
</span>
</span>
<span class="image-link">
<span
style="margin: 0 0 20px 0; display: inline-block; vertical-align: middle; width: 100%;"
>
<a
target="_blank"
href="https://pikwizard.com/video/animated-financial-data-chart-with-dynamic-lines/b05f12b76aeb49bf89c3d4b80f76ec61/"
style="text-decoration: none; font-size: 10px; margin: 0;"
>
<video controls style="width: 100%; margin: 0;">
<source src="https://player.vimeo.com/progressive_redirect/playback/715935188/rendition/240p/file.mp4?loc=external&oauth2_token_id=1223210874&signature=6401561e6fa6a0b09d107a81bbe5f4ab5e1be617dd418677bfc9d91082be9186" type="video/mp4"
poster="https://pikwizard.com/pw/medium/b05f12b76aeb49bf89c3d4b80f76ec61.jpg"/>
Your browser does not support the video tag.
</video>
<p style="font-size: 12px; margin: 0;">PikWizard</p>
</a>
</span>
</span>
Free (free of charge)
Free for personal and commercial use.
Author: Awesome Content