
- Home >
- Stock Videos >
- Animated Financial Data Charts with Digital Grid Background
Animated Financial Data Charts with Digital Grid Background Video
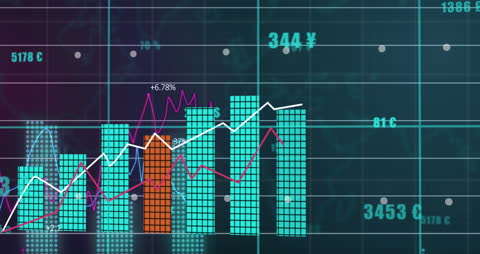
This animation presents a dynamic visualization of financial data with bar and line charts over a digital grid background. The vivid graphics indicate fluctuations in economic indicators, making it suitable for presentations on stock market analysis, financial reporting, or educational content about economics and finance.
Powered by  - Get 15% off with code: PIKWIZARD15


downloads
Tags:
More
Credit Photo
If you would like to credit the Photo, here are some ways you can do so
Text Link
video Link
<span class="text-link">
<span>
<a target="_blank" href=https://pikwizard.com/video/animated-financial-data-charts-with-digital-grid-background/692a64935a65e79d284d78172fcedfec/>PikWizard</a>
</span>
</span>
<span class="image-link">
<span
style="margin: 0 0 20px 0; display: inline-block; vertical-align: middle; width: 100%;"
>
<a
target="_blank"
href="https://pikwizard.com/video/animated-financial-data-charts-with-digital-grid-background/692a64935a65e79d284d78172fcedfec/"
style="text-decoration: none; font-size: 10px; margin: 0;"
>
<video controls style="width: 100%; margin: 0;">
<source src="https://player.vimeo.com/progressive_redirect/playback/794657576/rendition/360p/file.mp4?loc=external&oauth2_token_id=1223210874&signature=c86b9fbcf33d07513c487b4562aac3f8b0f1c3a7094c4209ca761f4f5547f690" type="video/mp4"
poster="https://pikwizard.com/pw/medium/692a64935a65e79d284d78172fcedfec.jpg"/>
Your browser does not support the video tag.
</video>
<p style="font-size: 12px; margin: 0;">PikWizard</p>
</a>
</span>
</span>
Free (free of charge)
Free for personal and commercial use.
Author: Awesome Content