
- Home >
- Stock Videos >
- Animated Financial Data Interface with Digital Graphs
Animated Financial Data Interface with Digital Graphs Video
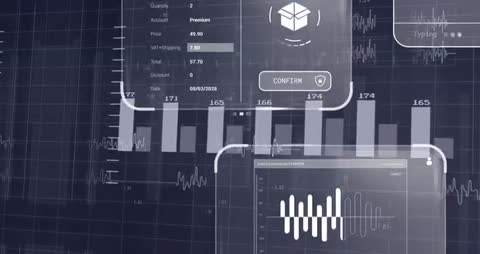
Animated depiction showcasing digital graphs and a financial data interface on a computer screen. Featuring dynamic graphs and charts, it encompasses elements like quantity, price, costs, and confirming actions in financial transactions. Ideal for presentations about finance, analytics, technology trends, or investment strategies. Useful for educational content, finance seminars, technology workshops, and demonstrating modern financial data management methods.

downloads
Tags:
More
Credit Photo
If you would like to credit the Photo, here are some ways you can do so
Text Link
video Link
<span class="text-link">
<span>
<a target="_blank" href=https://pikwizard.com/video/animated-financial-data-interface-with-digital-graphs/b4a13c77a303ce734b8d38ecb25864a0/>PikWizard</a>
</span>
</span>
<span class="image-link">
<span
style="margin: 0 0 20px 0; display: inline-block; vertical-align: middle; width: 100%;"
>
<a
target="_blank"
href="https://pikwizard.com/video/animated-financial-data-interface-with-digital-graphs/b4a13c77a303ce734b8d38ecb25864a0/"
style="text-decoration: none; font-size: 10px; margin: 0;"
>
<video controls style="width: 100%; margin: 0;">
<source src="https://player.vimeo.com/progressive_redirect/playback/1063348426/rendition/240p/file.mp4?loc=external&oauth2_token_id=1223210874&signature=11e889d7bd6707787c71ba0eb5b649d891fd44d788882705488849bed4399cf7&user_id=91254407" type="video/mp4"
poster="https://pikwizard.com/pw/medium/b4a13c77a303ce734b8d38ecb25864a0.jpg"/>
Your browser does not support the video tag.
</video>
<p style="font-size: 12px; margin: 0;">PikWizard</p>
</a>
</span>
</span>
Free (free of charge)
Free for personal and commercial use.
Author: Awesome Content