
- Home >
- Stock Videos >
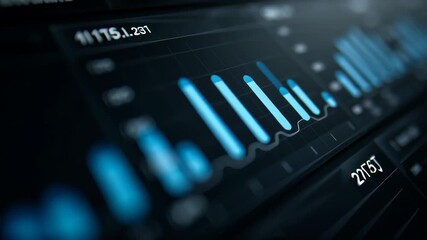
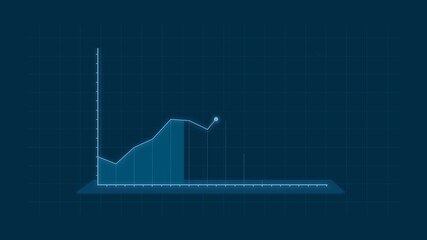
- Animated Financial Data Visualization and Analytics Art
Animated Financial Data Visualization and Analytics Art Video

Visual highlighting of animated financial and statistical data, offering insights into global digital interactions. This vibrant design can be template use for financial reports, digital presentations, data analysis frameworks, or educational content on global economic trends.
Powered by 


downloads
Tags:
More
Credit Photo
If you would like to credit the Photo, here are some ways you can do so
Text Link
video Link
<span class="text-link">
<span>
<a target="_blank" href=https://pikwizard.com/video/animated-financial-data-visualization-and-analytics-art/0214db12824a111b4015838a6379d10e/>PikWizard</a>
</span>
</span>
<span class="image-link">
<span
style="margin: 0 0 20px 0; display: inline-block; vertical-align: middle; width: 100%;"
>
<a
target="_blank"
href="https://pikwizard.com/video/animated-financial-data-visualization-and-analytics-art/0214db12824a111b4015838a6379d10e/"
style="text-decoration: none; font-size: 10px; margin: 0;"
>
<video controls style="width: 100%; margin: 0;">
<source src="https://player.vimeo.com/progressive_redirect/playback/760148573/rendition/240p/file.mp4?loc=external&oauth2_token_id=1223210874&signature=a54279636af8a833252579142b2a3dea0c01748dcec696a67ee4161b473db288" type="video/mp4"
poster="https://pikwizard.com/pw/medium/0214db12824a111b4015838a6379d10e.jpg"/>
Your browser does not support the video tag.
</video>
<p style="font-size: 12px; margin: 0;">PikWizard</p>
</a>
</span>
</span>
Free (free of charge)
Free for personal and commercial use.
Author: Awesome Content