
- Home >
- Stock Videos >
- Animated Financial Graphs and a World Map Highlighting Global Markets
Animated Financial Graphs and a World Map Highlighting Global Markets Video
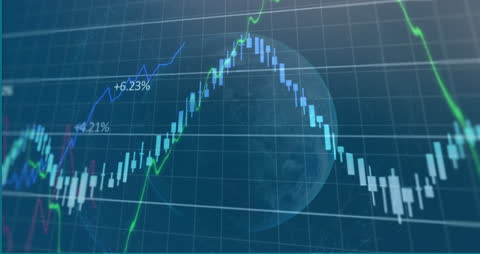
Harness the vibrant animation to underscore insights on financial trends and market analysis. Crucial for presentations and reports in finance and investment sectors, the depiction of graphs with a world map visual conveys a sense of evolving global markets and network technologies.
Powered by 


6
downloads
downloads
Tags:
More
Credit Photo
If you would like to credit the Photo, here are some ways you can do so
Text Link
video Link
<span class="text-link">
<span>
<a target="_blank" href=https://pikwizard.com/video/animated-financial-graphs-and-a-world-map-highlighting-global-markets/538fa9203dad320decd511130b7e71b4/>PikWizard</a>
</span>
</span>
<span class="image-link">
<span
style="margin: 0 0 20px 0; display: inline-block; vertical-align: middle; width: 100%;"
>
<a
target="_blank"
href="https://pikwizard.com/video/animated-financial-graphs-and-a-world-map-highlighting-global-markets/538fa9203dad320decd511130b7e71b4/"
style="text-decoration: none; font-size: 10px; margin: 0;"
>
<video controls style="width: 100%; margin: 0;">
<source src="https://player.vimeo.com/progressive_redirect/playback/719113772/rendition/240p/file.mp4?loc=external&oauth2_token_id=1223210874&signature=351ccde3342edb593b4f1e81ef72906c58609d76b0228f0d923a899707711831" type="video/mp4"
poster="https://pikwizard.com/pw/medium/538fa9203dad320decd511130b7e71b4.jpg"/>
Your browser does not support the video tag.
</video>
<p style="font-size: 12px; margin: 0;">PikWizard</p>
</a>
</span>
</span>
Free (free of charge)
Free for personal and commercial use.
Author: Awesome Content