
- Home >
- Stock Videos >
- Animated Financial Graphs and Data Visualization
Animated Financial Graphs and Data Visualization Video
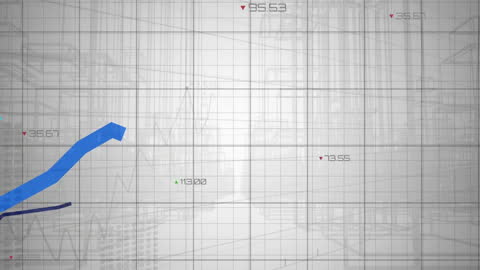
Animation shows dynamic changes in finance and business environments with multiple graphs and changing numbers. Suitable for illustrating financial reports, market analysis, economic growth presentations, business strategy workshops, and visual content for investment portals.

downloads
Tags:
More
Credit Photo
If you would like to credit the Photo, here are some ways you can do so
Text Link
video Link
<span class="text-link">
<span>
<a target="_blank" href=https://pikwizard.com/video/animated-financial-graphs-and-data-visualization/df33f781aca29d41fd5133300a9ed286/>PikWizard</a>
</span>
</span>
<span class="image-link">
<span
style="margin: 0 0 20px 0; display: inline-block; vertical-align: middle; width: 100%;"
>
<a
target="_blank"
href="https://pikwizard.com/video/animated-financial-graphs-and-data-visualization/df33f781aca29d41fd5133300a9ed286/"
style="text-decoration: none; font-size: 10px; margin: 0;"
>
<video controls style="width: 100%; margin: 0;">
<source src="https://player.vimeo.com/progressive_redirect/playback/907553981/rendition/240p/file.mp4?loc=external&oauth2_token_id=1223210874&signature=898ae64284dffb435d3edefadd2cdbcd592706d680ded54712bcfe8780c488da" type="video/mp4"
poster="https://pikwizard.com/pw/medium/df33f781aca29d41fd5133300a9ed286.jpg"/>
Your browser does not support the video tag.
</video>
<p style="font-size: 12px; margin: 0;">PikWizard</p>
</a>
</span>
</span>
Free (free of charge)
Free for personal and commercial use.
Author: Awesome Content