
- Home >
- Stock Videos >
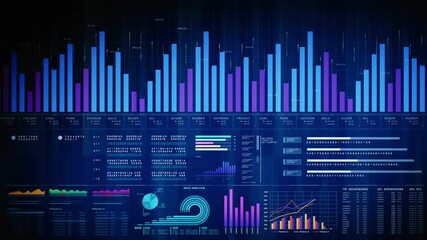
- Animated Financial Graphs on Industrial Pylons
Animated Financial Graphs on Industrial Pylons Video

Dynamic visual of economic data projected over silhouettes of industrial pylons during sunset. Represents the intersection of technology, finance, and infrastructure. Ideal for use in economic trend analysis presentations, website backdrops for technology firms, or educational content about global finance systems.
Powered by 


0
downloads
downloads
Tags:
More
Credit Photo
If you would like to credit the Photo, here are some ways you can do so
Text Link
video Link
<span class="text-link">
<span>
<a target="_blank" href=https://pikwizard.com/video/animated-financial-graphs-on-industrial-pylons/3ec45f13f05926f3b52b4450ebe54cf7/>PikWizard</a>
</span>
</span>
<span class="image-link">
<span
style="margin: 0 0 20px 0; display: inline-block; vertical-align: middle; width: 100%;"
>
<a
target="_blank"
href="https://pikwizard.com/video/animated-financial-graphs-on-industrial-pylons/3ec45f13f05926f3b52b4450ebe54cf7/"
style="text-decoration: none; font-size: 10px; margin: 0;"
>
<video controls style="width: 100%; margin: 0;">
<source src="https://player.vimeo.com/progressive_redirect/playback/752151291/rendition/240p/file.mp4?loc=external&oauth2_token_id=1223210874&signature=a8415da7f2afbbd6e7d6c82b1afa213a6ec8ab3871725a63067dc9f641b21daa" type="video/mp4"
poster="https://pikwizard.com/pw/medium/3ec45f13f05926f3b52b4450ebe54cf7.jpg"/>
Your browser does not support the video tag.
</video>
<p style="font-size: 12px; margin: 0;">PikWizard</p>
</a>
</span>
</span>
Free (free of charge)
Free for personal and commercial use.
Author: Awesome Content