
- Home >
- Stock Videos >
- Animated Financial Statistics on Digital Grid Display
Animated Financial Statistics on Digital Grid Display Video
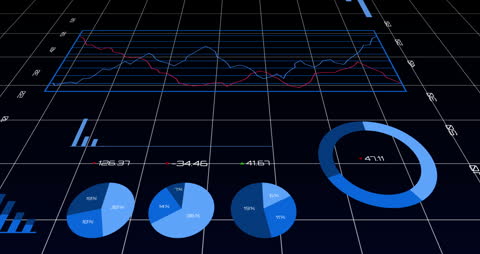
Visual showcases digital representation of financial data with animated graphs and pie charts overlaying a grid. Ideal for themes on global economics, market analysis, and technology integration in business. Useful for illustrating modern data-driven decision-making scenarios in presentations, reports, and fintech content.
Powered by  - Get 15% off with code: PIKWIZARD15


downloads
Tags:
More
Credit Photo
If you would like to credit the Photo, here are some ways you can do so
Text Link
video Link
<span class="text-link">
<span>
<a target="_blank" href=https://pikwizard.com/video/animated-financial-statistics-on-digital-grid-display/ec2f8e7ebfc9f987f3fb8d3b5589417a/>PikWizard</a>
</span>
</span>
<span class="image-link">
<span
style="margin: 0 0 20px 0; display: inline-block; vertical-align: middle; width: 100%;"
>
<a
target="_blank"
href="https://pikwizard.com/video/animated-financial-statistics-on-digital-grid-display/ec2f8e7ebfc9f987f3fb8d3b5589417a/"
style="text-decoration: none; font-size: 10px; margin: 0;"
>
<video controls style="width: 100%; margin: 0;">
<source src="https://player.vimeo.com/external/443386526.sd.mp4?s=0dcb62dbc47d24aea4982052efd6238ce1882cf7&profile_id=139&oauth2_token_id=1223210874" type="video/mp4"
poster="https://pikwizard.com/pw/medium/ec2f8e7ebfc9f987f3fb8d3b5589417a.jpg"/>
Your browser does not support the video tag.
</video>
<p style="font-size: 12px; margin: 0;">PikWizard</p>
</a>
</span>
</span>
Free (free of charge)
Free for personal and commercial use.
Author: Awesome Content