
- Home >
- Stock Videos >
- Animated Global Data Analytics and Financial Graph Presentation
Animated Global Data Analytics and Financial Graph Presentation Video
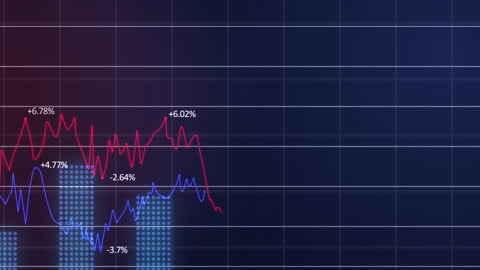
Visualization shows animated data processing with financial and statistical graphs overlaid on a digital grid. Useful for presentations on global business trends, economic analysis, stock market reports, and infographics related to data analytics and technology impacts on finance.

downloads
Tags:
More
Credit Photo
If you would like to credit the Photo, here are some ways you can do so
Text Link
video Link
<span class="text-link">
<span>
<a target="_blank" href=https://pikwizard.com/video/animated-global-data-analytics-and-financial-graph-presentation/b7bcfcadac97635b4091f1e0c8169fb8/>PikWizard</a>
</span>
</span>
<span class="image-link">
<span
style="margin: 0 0 20px 0; display: inline-block; vertical-align: middle; width: 100%;"
>
<a
target="_blank"
href="https://pikwizard.com/video/animated-global-data-analytics-and-financial-graph-presentation/b7bcfcadac97635b4091f1e0c8169fb8/"
style="text-decoration: none; font-size: 10px; margin: 0;"
>
<video controls style="width: 100%; margin: 0;">
<source src="https://player.vimeo.com/progressive_redirect/playback/798424594/rendition/240p/file.mp4?loc=external&oauth2_token_id=1223210874&signature=5d368c572fa87169e1190dff64ce2ac50443f5706c3321f35439893cc9fff6c7" type="video/mp4"
poster="https://pikwizard.com/pw/medium/b7bcfcadac97635b4091f1e0c8169fb8.jpg"/>
Your browser does not support the video tag.
</video>
<p style="font-size: 12px; margin: 0;">PikWizard</p>
</a>
</span>
</span>
Free (free of charge)
Free for personal and commercial use.
Author: Awesome Content