
- Home >
- Stock Videos >
- Animated Graph Data Visualization with Digital Globe
Animated Graph Data Visualization with Digital Globe Video
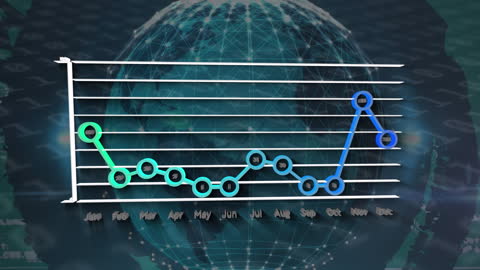
This video displays an animated graph illustrating data trends over months layered against a digital globe, symbolizing worldwide technology and information dynamics. Useful for presentations on global connectivity, data analytics, technology trends, and statistical analysis, as well as for illustrating concepts in digital and technological sectors.

downloads
Tags:
More
Credit Photo
If you would like to credit the Photo, here are some ways you can do so
Text Link
video Link
<span class="text-link">
<span>
<a target="_blank" href=https://pikwizard.com/video/animated-graph-data-visualization-with-digital-globe/01773d94dcf1dab676112c8f7b8502d7/>PikWizard</a>
</span>
</span>
<span class="image-link">
<span
style="margin: 0 0 20px 0; display: inline-block; vertical-align: middle; width: 100%;"
>
<a
target="_blank"
href="https://pikwizard.com/video/animated-graph-data-visualization-with-digital-globe/01773d94dcf1dab676112c8f7b8502d7/"
style="text-decoration: none; font-size: 10px; margin: 0;"
>
<video controls style="width: 100%; margin: 0;">
<source src="https://player.vimeo.com/progressive_redirect/playback/736222455/rendition/240p/file.mp4?loc=external&oauth2_token_id=1223210874&signature=7df3649a8f50dcf9d43089b6b4c53872d6cff534e2feee702f8bd48393cc5670" type="video/mp4"
poster="https://pikwizard.com/pw/medium/01773d94dcf1dab676112c8f7b8502d7.jpg"/>
Your browser does not support the video tag.
</video>
<p style="font-size: 12px; margin: 0;">PikWizard</p>
</a>
</span>
</span>
Free (free of charge)
Free for personal and commercial use.
Author: Awesome Content