
- Home >
- Stock Videos >
- Animated Red Line Graph with Economic Data on Grid Background
Animated Red Line Graph with Economic Data on Grid Background Video
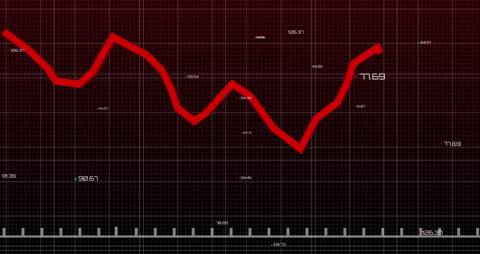
Red animation featured over a grid background with various numeric data emphasizes concept of fluctuating economic fluctuations. Suitable for use in presentations related to financial analysis, economic reports or business growth projections. Ideal for video content about market trends, stock evaluation and data technology demonstrations.
Powered by 


downloads
Tags:
More
Credit Photo
If you would like to credit the Photo, here are some ways you can do so
Text Link
video Link
<span class="text-link">
<span>
<a target="_blank" href=https://pikwizard.com/video/animated-red-line-graph-with-economic-data-on-grid-background/9af3f20247bb4bcd52e2f4544b46313a/>PikWizard</a>
</span>
</span>
<span class="image-link">
<span
style="margin: 0 0 20px 0; display: inline-block; vertical-align: middle; width: 100%;"
>
<a
target="_blank"
href="https://pikwizard.com/video/animated-red-line-graph-with-economic-data-on-grid-background/9af3f20247bb4bcd52e2f4544b46313a/"
style="text-decoration: none; font-size: 10px; margin: 0;"
>
<video controls style="width: 100%; margin: 0;">
<source src="https://player.vimeo.com/progressive_redirect/playback/717396976/rendition/240p/file.mp4?loc=external&oauth2_token_id=1223210874&signature=479a3b726f69cbe1e604e5ff9bb0c4724f0d3d448520f13312cfd4f76c1b118e" type="video/mp4"
poster="https://pikwizard.com/pw/medium/9af3f20247bb4bcd52e2f4544b46313a.jpg"/>
Your browser does not support the video tag.
</video>
<p style="font-size: 12px; margin: 0;">PikWizard</p>
</a>
</span>
</span>
Free (free of charge)
Free for personal and commercial use.
Author: Awesome Content