
- Home >
- Stock Videos >
- Animated Stock Data Visualization Overlay on Cityscape
Animated Stock Data Visualization Overlay on Cityscape Video
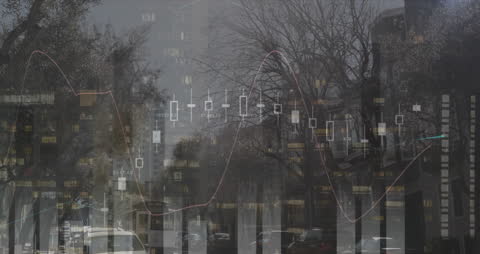
Digital visualization showing a fluctuating graph assessed by financial analysts. Useful for finance and stock market themes, displaying technological advancements in business data processing. Ideal for websites, presentations, and educational materials on economics or urban trading environments.
Powered by 


downloads
Tags:
More
Credit Photo
If you would like to credit the Photo, here are some ways you can do so
Text Link
video Link
<span class="text-link">
<span>
<a target="_blank" href=https://pikwizard.com/video/animated-stock-data-visualization-overlay-on-cityscape/2bd1e0ba2b80114b5a49812b1ceac09b/>PikWizard</a>
</span>
</span>
<span class="image-link">
<span
style="margin: 0 0 20px 0; display: inline-block; vertical-align: middle; width: 100%;"
>
<a
target="_blank"
href="https://pikwizard.com/video/animated-stock-data-visualization-overlay-on-cityscape/2bd1e0ba2b80114b5a49812b1ceac09b/"
style="text-decoration: none; font-size: 10px; margin: 0;"
>
<video controls style="width: 100%; margin: 0;">
<source src="https://player.vimeo.com/progressive_redirect/playback/828705482/rendition/240p/file.mp4?loc=external&oauth2_token_id=1223210874&signature=309ae0819c6792e8d4c558dd63e9ba80f8c760823a6d197180b5bc73930c3cfd" type="video/mp4"
poster="https://pikwizard.com/pw/medium/2bd1e0ba2b80114b5a49812b1ceac09b.jpg"/>
Your browser does not support the video tag.
</video>
<p style="font-size: 12px; margin: 0;">PikWizard</p>
</a>
</span>
</span>
Free (free of charge)
Free for personal and commercial use.
Author: Awesome Content