
- Home >
- Stock Videos >
- Animated Visualization of Stock Market Data Trends
Animated Visualization of Stock Market Data Trends Video
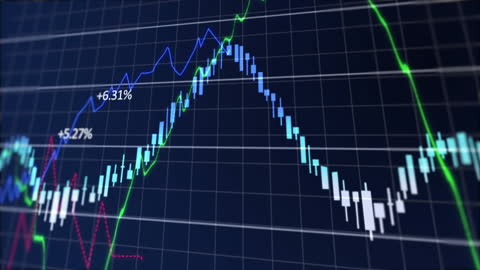
Animated scene displaying fluctuating financial data trends over a digital grid. Suitable for illustrating economic reports, business presentations, or educational materials on stock market analysis and global finance.
Powered by 


1
downloads
downloads
Tags:
More
Credit Photo
If you would like to credit the Photo, here are some ways you can do so
Text Link
video Link
<span class="text-link">
<span>
<a target="_blank" href=https://pikwizard.com/video/animated-visualization-of-stock-market-data-trends/78ff3a25291c8d920fa0bd2389ef0770/>PikWizard</a>
</span>
</span>
<span class="image-link">
<span
style="margin: 0 0 20px 0; display: inline-block; vertical-align: middle; width: 100%;"
>
<a
target="_blank"
href="https://pikwizard.com/video/animated-visualization-of-stock-market-data-trends/78ff3a25291c8d920fa0bd2389ef0770/"
style="text-decoration: none; font-size: 10px; margin: 0;"
>
<video controls style="width: 100%; margin: 0;">
<source src="https://player.vimeo.com/progressive_redirect/playback/948519023/rendition/720p/file.mp4?loc=external&oauth2_token_id=1223210874&signature=8b3586105e6dcd7b83e1564c4e414dee9ebba95b865f556172be6c497317401c" type="video/mp4"
poster="https://pikwizard.com/pw/medium/78ff3a25291c8d920fa0bd2389ef0770.jpg"/>
Your browser does not support the video tag.
</video>
<p style="font-size: 12px; margin: 0;">PikWizard</p>
</a>
</span>
</span>
Free (free of charge)
Free for personal and commercial use.
Author: Awesome Content