
- Home >
- Free Stock Videos >
- Animating multi-channel data trends with neon waveforms, particle network traces
Animating multi-channel data trends with neon waveforms, particle network traces Free Stock Video
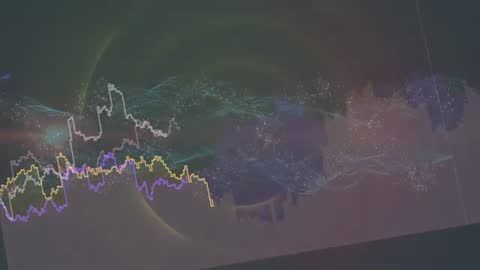
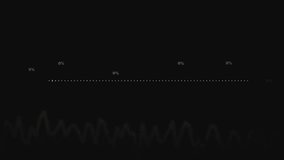
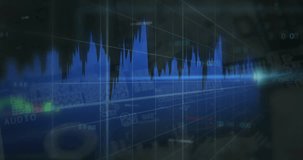
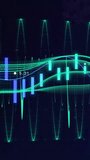
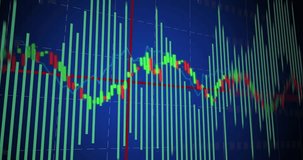
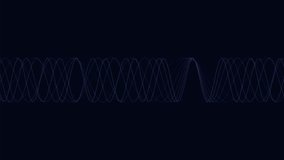
Visualizing multi-channel time series with layered neon waveforms, stepped histogram traces, and drifting particle network, presenting rising and falling trend patterns across teal ribbon of motion. Featuring colored jagged line charts aligned over flowing data streams and scattered point clusters suggesting complex analytics and signal activity. Creating immersive abstract backdrop for tech and finance content. Use ideas: - Using as loopable background for financial news tickers, trading platform demos, and market analysis videos - Using as opening graphics for data science presentations, webinar intros, and investor pitches - Using as website hero animation for fintech startups, analytics dashboards, and blockchain platforms - Using as overlay for music visualizers, signal processing tutorials, and science explainer videos Customization tips: - Adjusting color palette to match brand identity - Adding logo reveal and lower-third text over darker zones - Syncing motion to audio for rhythmic visuals - Layering transparent data labels or live metrics for dashboard integrations
Powered by  - Get 15% off with code: PIKWIZARD15

downloads
Tags:
More
Credit Photo
If you would like to credit the Photo, here are some ways you can do so
Text Link
video Link
<span class="text-link">
<span>
<a target="_blank" href=https://pikwizard.com/video/animating-multi-channel-data-trends-with-neon-waveforms-particle-network-traces/a4022d5edd4239ae827cca42b1151c62/>PikWizard</a>
</span>
</span>
<span class="image-link">
<span
style="margin: 0 0 20px 0; display: inline-block; vertical-align: middle; width: 100%;"
>
<a
target="_blank"
href="https://pikwizard.com/video/animating-multi-channel-data-trends-with-neon-waveforms-particle-network-traces/a4022d5edd4239ae827cca42b1151c62/"
style="text-decoration: none; font-size: 10px; margin: 0;"
>
<video controls style="width: 100%; margin: 0;">
<source src="https://player.vimeo.com/progressive_redirect/playback/1194106244/rendition/240p/file.mp4%20%28240p%29.mp4?loc=external&oauth2_token_id=1223210874&signature=d19f1fa1721908ff7e0bb6d254836aba75a65f21a14e6cbde2dd208aca468959" type="video/mp4"
poster="https://thumbs.wbm.im/pw/medium/a4022d5edd4239ae827cca42b1151c62.jpg"/>
Your browser does not support the video tag.
</video>
<p style="font-size: 12px; margin: 0;">PikWizard</p>
</a>
</span>
</span>
Free (free of charge)
Free for personal and commercial use.
Author: Awesome Content