
- Home >
- Stock Videos >
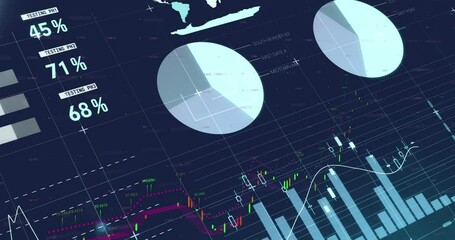
- Animation of Finance and Technology Data with Graphs and Codes
Animation of Finance and Technology Data with Graphs and Codes Video
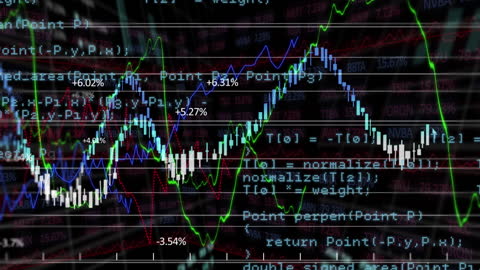
This visually dynamic scene captures animated graphs and coding overlaying against a dark backdrop, illustrating complex data processing in finance and technology sectors. The intricate mix of visual information symbolizes study of financial trends, trading computations, and quantitative analysis. Use in contexts focusing on high-tech finance innovation, digital analytics or presentations about data-driven decision making.
Powered by 


0
downloads
downloads
Tags:
More
Credit Photo
If you would like to credit the Photo, here are some ways you can do so
Text Link
video Link
<span class="text-link">
<span>
<a target="_blank" href=https://pikwizard.com/video/animation-of-finance-and-technology-data-with-graphs-and-codes/5a59809800a96540055c5072739a8770/>PikWizard</a>
</span>
</span>
<span class="image-link">
<span
style="margin: 0 0 20px 0; display: inline-block; vertical-align: middle; width: 100%;"
>
<a
target="_blank"
href="https://pikwizard.com/video/animation-of-finance-and-technology-data-with-graphs-and-codes/5a59809800a96540055c5072739a8770/"
style="text-decoration: none; font-size: 10px; margin: 0;"
>
<video controls style="width: 100%; margin: 0;">
<source src="https://player.vimeo.com/progressive_redirect/playback/719239924/rendition/240p/file.mp4?loc=external&oauth2_token_id=1223210874&signature=27014bbc9ee3ffb5a55728e489c446d60d284a216db93c412b963aa689131638" type="video/mp4"
poster="https://pikwizard.com/pw/medium/5a59809800a96540055c5072739a8770.jpg"/>
Your browser does not support the video tag.
</video>
<p style="font-size: 12px; margin: 0;">PikWizard</p>
</a>
</span>
</span>
Free (free of charge)
Free for personal and commercial use.
Author: Awesome Content