
- Home >
- Stock Videos >
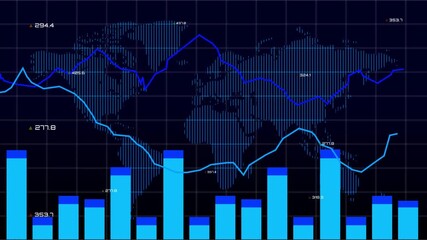
- Animation of Financial Data with Globe and Statistics
Animation of Financial Data with Globe and Statistics Video

This digital animation depicts financial data processing with charts and a globe, symbolizing global business and finance. The visual representation of statistics is ideal for illustrating economic reports, investment presentations, or educational materials on global market trends.
Powered by 


0
downloads
downloads
Tags:
More
Credit Photo
If you would like to credit the Photo, here are some ways you can do so
Text Link
video Link
<span class="text-link">
<span>
<a target="_blank" href=https://pikwizard.com/video/animation-of-financial-data-with-globe-and-statistics/4b3044657edb0c6fe160b7c85f02b51e/>PikWizard</a>
</span>
</span>
<span class="image-link">
<span
style="margin: 0 0 20px 0; display: inline-block; vertical-align: middle; width: 100%;"
>
<a
target="_blank"
href="https://pikwizard.com/video/animation-of-financial-data-with-globe-and-statistics/4b3044657edb0c6fe160b7c85f02b51e/"
style="text-decoration: none; font-size: 10px; margin: 0;"
>
<video controls style="width: 100%; margin: 0;">
<source src="https://player.vimeo.com/progressive_redirect/playback/908020899/rendition/240p/file.mp4?loc=external&oauth2_token_id=1223210874&signature=522526a70bb58d8514c3c096443ceb5525c2ad967e7f897cb13fe494c74098b9" type="video/mp4"
poster="https://pikwizard.com/pw/medium/4b3044657edb0c6fe160b7c85f02b51e.jpg"/>
Your browser does not support the video tag.
</video>
<p style="font-size: 12px; margin: 0;">PikWizard</p>
</a>
</span>
</span>
Free (free of charge)
Free for personal and commercial use.
Author: Awesome Content