
- Home >
- Stock Videos >
- Bar Graphs and Data Overlap on Styled Global Map
Bar Graphs and Data Overlap on Styled Global Map Video
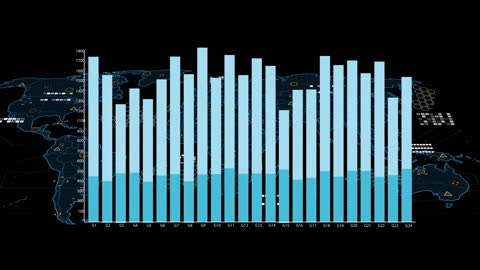
Visually appealing data representations on a world map silhouette illustrate global business concepts and economic trends. Useful for presentations, reports on financial technology, worldwide market analysis.
Powered by 


downloads
Tags:
More
Credit Photo
If you would like to credit the Photo, here are some ways you can do so
Text Link
video Link
<span class="text-link">
<span>
<a target="_blank" href=https://pikwizard.com/video/bar-graphs-and-data-overlap-on-styled-global-map/0a7bbe8f27640f1263c90ef6ca975927/>PikWizard</a>
</span>
</span>
<span class="image-link">
<span
style="margin: 0 0 20px 0; display: inline-block; vertical-align: middle; width: 100%;"
>
<a
target="_blank"
href="https://pikwizard.com/video/bar-graphs-and-data-overlap-on-styled-global-map/0a7bbe8f27640f1263c90ef6ca975927/"
style="text-decoration: none; font-size: 10px; margin: 0;"
>
<video controls style="width: 100%; margin: 0;">
<source src="https://player.vimeo.com/progressive_redirect/playback/731296851/rendition/240p/file.mp4?loc=external&oauth2_token_id=1223210874&signature=f2c0954a3f61ad0ef7e8424d13baa105e486bb76bb26bc19f79b0e67202b7a69" type="video/mp4"
poster="https://pikwizard.com/pw/medium/0a7bbe8f27640f1263c90ef6ca975927.jpg"/>
Your browser does not support the video tag.
</video>
<p style="font-size: 12px; margin: 0;">PikWizard</p>
</a>
</span>
</span>
Free (free of charge)
Free for personal and commercial use.
Author: Awesome Content