
- Home >
- Stock Videos >
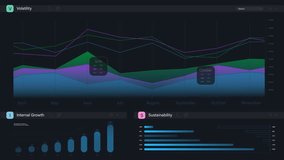
- Blue and Black Interface for Financial Market Analysis
Blue and Black Interface for Financial Market Analysis Video

Features a futuristic design with various financial charts and indicators. Ideal for illustrating articles about financial technology, stock market trends, and data analytics. Useful for presentations on business intelligence, market growth, and digital financial technologies.
Powered by  - Get 15% off with code: PIKWIZARD15


1
downloads
downloads
Tags:
More
Credit Photo
If you would like to credit the Photo, here are some ways you can do so
Text Link
video Link
<span class="text-link">
<span>
<a target="_blank" href=https://pikwizard.com/video/blue-and-black-interface-for-financial-market-analysis/c9872c3e804c6cba2793b88135f4b4a5/>PikWizard</a>
</span>
</span>
<span class="image-link">
<span
style="margin: 0 0 20px 0; display: inline-block; vertical-align: middle; width: 100%;"
>
<a
target="_blank"
href="https://pikwizard.com/video/blue-and-black-interface-for-financial-market-analysis/c9872c3e804c6cba2793b88135f4b4a5/"
style="text-decoration: none; font-size: 10px; margin: 0;"
>
<video controls style="width: 100%; margin: 0;">
<source src="https://player.vimeo.com/progressive_redirect/playback/768326647/rendition/240p/file.mp4?loc=external&oauth2_token_id=1223210874&signature=dc0d6650cd75d52754f237a4a386e601de492b6c7179918c7edcadc484af8076" type="video/mp4"
poster="https://pikwizard.com/pw/medium/c9872c3e804c6cba2793b88135f4b4a5.jpg"/>
Your browser does not support the video tag.
</video>
<p style="font-size: 12px; margin: 0;">PikWizard</p>
</a>
</span>
</span>
Free (free of charge)
Free for personal and commercial use.
Author: Awesome Content