
- Home >
- Stock Videos >
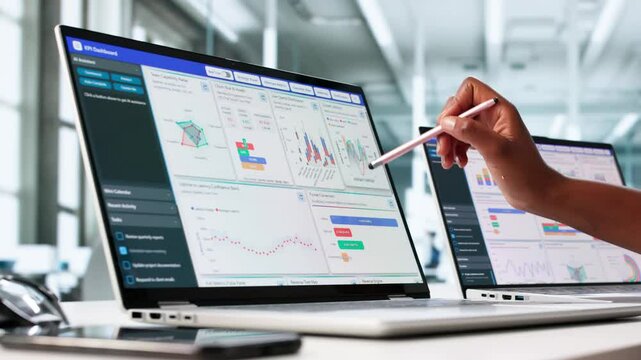
- Business Analytics with Transparent Financial Charts
Business Analytics with Transparent Financial Charts Video

Visualization of a business setting with transparent financial charts overlaying professionals in a work environment. Perfect for use in presentations or media related to data analysis, corporate strategy, and financial services.
Powered by 


2
downloads
downloads
Tags:
More
Credit Photo
If you would like to credit the Photo, here are some ways you can do so
Text Link
video Link
<span class="text-link">
<span>
<a target="_blank" href=https://pikwizard.com/video/business-analytics-with-transparent-financial-charts/862302385d6eb7922780fc0b33c3a28f/>PikWizard</a>
</span>
</span>
<span class="image-link">
<span
style="margin: 0 0 20px 0; display: inline-block; vertical-align: middle; width: 100%;"
>
<a
target="_blank"
href="https://pikwizard.com/video/business-analytics-with-transparent-financial-charts/862302385d6eb7922780fc0b33c3a28f/"
style="text-decoration: none; font-size: 10px; margin: 0;"
>
<video controls style="width: 100%; margin: 0;">
<source src="https://player.vimeo.com/progressive_redirect/playback/774013117/rendition/240p/file.mp4?loc=external&oauth2_token_id=1223210874&signature=ca7bcb805f1ad27f10c43c8ca04e6e2df533c3e5ed817a715a86d3efe48a0612" type="video/mp4"
poster="https://pikwizard.com/pw/medium/862302385d6eb7922780fc0b33c3a28f.jpg"/>
Your browser does not support the video tag.
</video>
<p style="font-size: 12px; margin: 0;">PikWizard</p>
</a>
</span>
</span>
Free (free of charge)
Free for personal and commercial use.
Author: Awesome Content