
- Home >
- Stock Videos >
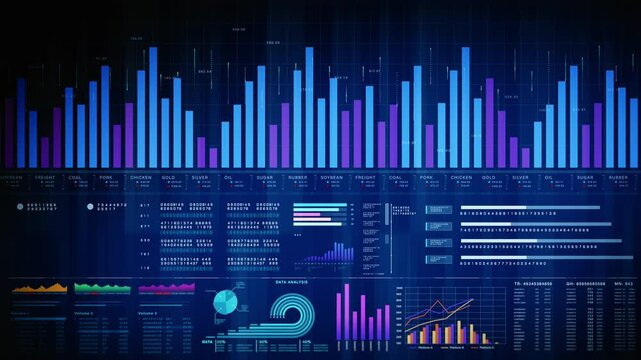
- Business Professional Analyzing Dynamic Digital Financial Reports
Business Professional Analyzing Dynamic Digital Financial Reports Video

The scene depicts a professional engaged in analyzing animated financial data charts and pie graphs overlaid on a digital board. This videory is perfect for presentations or articles related to business analytics, financial technology, or modern data analysis techniques. It can serve as an illustration for topics on improving business intelligence, reporting accuracy, and computational statistics in the digital age.
Powered by 


0
downloads
downloads
Tags:
More
Credit Photo
If you would like to credit the Photo, here are some ways you can do so
Text Link
video Link
<span class="text-link">
<span>
<a target="_blank" href=https://pikwizard.com/video/business-professional-analyzing-dynamic-digital-financial-reports/5a8d854f1faae5ce3194c5b81d38c897/>PikWizard</a>
</span>
</span>
<span class="image-link">
<span
style="margin: 0 0 20px 0; display: inline-block; vertical-align: middle; width: 100%;"
>
<a
target="_blank"
href="https://pikwizard.com/video/business-professional-analyzing-dynamic-digital-financial-reports/5a8d854f1faae5ce3194c5b81d38c897/"
style="text-decoration: none; font-size: 10px; margin: 0;"
>
<video controls style="width: 100%; margin: 0;">
<source src="https://player.vimeo.com/progressive_redirect/playback/996004550/rendition/240p/file.mp4?loc=external&oauth2_token_id=1223210874&signature=a0e53897b6529a467e9a2e76c41bfa54ffa9f507aae83343315bc979f5d34748" type="video/mp4"
poster="https://pikwizard.com/pw/medium/5a8d854f1faae5ce3194c5b81d38c897.jpg"/>
Your browser does not support the video tag.
</video>
<p style="font-size: 12px; margin: 0;">PikWizard</p>
</a>
</span>
</span>
Free (free of charge)
Free for personal and commercial use.
Author: Awesome Content