
- Home >
- Stock Videos >
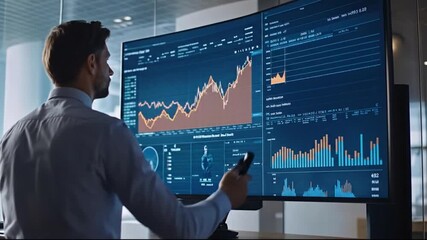
- Businessman Analyzing Stock Market Data Visualization
Businessman Analyzing Stock Market Data Visualization Video

This illustration shows the integration of technology with financial analysis, featuring a businessman actively engaged in examining stock market data at work. The digital overlay of charts and percentages emphasizes themes of financial strategy, trading, and informed decision-making. Ideal for articles, financial blogs, and technology-focused business presentations appealing to entrepreneurs, investors, and financial professionals.
Powered by 


downloads
Tags:
More
Credit Photo
If you would like to credit the Photo, here are some ways you can do so
Text Link
video Link
<span class="text-link">
<span>
<a target="_blank" href=https://pikwizard.com/video/businessman-analyzing-stock-market-data-visualization/4366d7f27fa40b4ab8bfce2e28335ca9/>PikWizard</a>
</span>
</span>
<span class="image-link">
<span
style="margin: 0 0 20px 0; display: inline-block; vertical-align: middle; width: 100%;"
>
<a
target="_blank"
href="https://pikwizard.com/video/businessman-analyzing-stock-market-data-visualization/4366d7f27fa40b4ab8bfce2e28335ca9/"
style="text-decoration: none; font-size: 10px; margin: 0;"
>
<video controls style="width: 100%; margin: 0;">
<source src="https://player.vimeo.com/progressive_redirect/playback/908022559/rendition/240p/file.mp4?loc=external&oauth2_token_id=1223210874&signature=3d58989f7a53e4865491b38c4fa92ca51024b9f219e781d6d07ef923e7acc54e" type="video/mp4"
poster="https://pikwizard.com/pw/medium/4366d7f27fa40b4ab8bfce2e28335ca9.jpg"/>
Your browser does not support the video tag.
</video>
<p style="font-size: 12px; margin: 0;">PikWizard</p>
</a>
</span>
</span>
Free (free of charge)
Free for personal and commercial use.
Author: Awesome Content