
- Home >
- Stock Videos >
- Businessman Analyzing Virtual Financial Data Graphics
Businessman Analyzing Virtual Financial Data Graphics Video
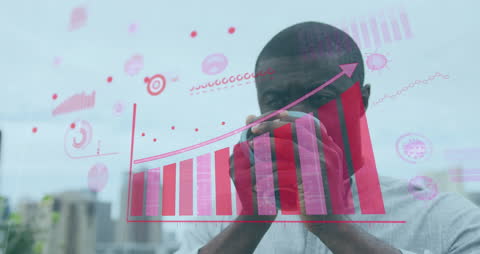
A professional businessman is analyzing virtual financial data displayed as charts and graphs, representing growth trends and economic analysis. Ideal for use in promotional materials for financial services, technology-driven business solutions, or digital advertising highlighting investment consultancy services.
Powered by 


downloads
Tags:
More
Credit Photo
If you would like to credit the Photo, here are some ways you can do so
Text Link
video Link
<span class="text-link">
<span>
<a target="_blank" href=https://pikwizard.com/video/businessman-analyzing-virtual-financial-data-graphics/a2ce4ed8a739dbdccc022fff0efd12d8/>PikWizard</a>
</span>
</span>
<span class="image-link">
<span
style="margin: 0 0 20px 0; display: inline-block; vertical-align: middle; width: 100%;"
>
<a
target="_blank"
href="https://pikwizard.com/video/businessman-analyzing-virtual-financial-data-graphics/a2ce4ed8a739dbdccc022fff0efd12d8/"
style="text-decoration: none; font-size: 10px; margin: 0;"
>
<video controls style="width: 100%; margin: 0;">
<source src="https://player.vimeo.com/progressive_redirect/playback/718288135/rendition/240p/file.mp4?loc=external&oauth2_token_id=1223210874&signature=301ea965431b7e3e16573556584454cecb1152d02c65c6d45c118f3179ef9825" type="video/mp4"
poster="https://pikwizard.com/pw/medium/a2ce4ed8a739dbdccc022fff0efd12d8.jpg"/>
Your browser does not support the video tag.
</video>
<p style="font-size: 12px; margin: 0;">PikWizard</p>
</a>
</span>
</span>
Free (free of charge)
Free for personal and commercial use.
Author: Awesome Content