
- Home >
- Free Stock Videos >
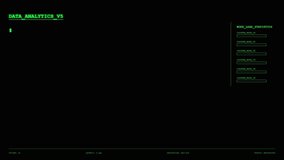
- Cloud Analytics Dashboard Visualizing Real-Time Streaming Data with Pulsing Green Clusters and Purpl
Cloud Analytics Dashboard Visualizing Real-Time Streaming Data with Pulsing Green Clusters and Purpl Free Stock Video

Frame showing cloud-based analytics visualization with layered purple histograms, green bar clusters, waveform traces, gridlines and scrolling code overlay over soft cloud backdrop. Visual elements moving subtly: purple bars rising, green cluster pulsing, waveforms flowing, code strings cascading, creating high-tech cinematic feel. Color palette featuring cool blues, vibrant purple and neon green, creating contrast for data highlights. Use for technology product demos, SaaS landing pages, fintech presentations, data science articles, corporate reports, explainer videos, pitch decks and broadcast graphics. Suitable for looping background, hero header, scene transition, or motion graphics overlay. Footage adapting well to branding with color grading, text overlay, or animated callouts for KPI emphasis.
Powered by  - Get 15% off with code: PIKWIZARD15


downloads
Tags:
More
Credit Photo
If you would like to credit the Photo, here are some ways you can do so
Text Link
video Link
<span class="text-link">
<span>
<a target="_blank" href=https://pikwizard.com/video/cloud-analytics-dashboard-visualizing-real-time-streaming-data-with-pulsing-green-clusters-and-purpl/ddd5b05d2e3d53fe679c3e9d08a08fc6/>PikWizard</a>
</span>
</span>
<span class="image-link">
<span
style="margin: 0 0 20px 0; display: inline-block; vertical-align: middle; width: 100%;"
>
<a
target="_blank"
href="https://pikwizard.com/video/cloud-analytics-dashboard-visualizing-real-time-streaming-data-with-pulsing-green-clusters-and-purpl/ddd5b05d2e3d53fe679c3e9d08a08fc6/"
style="text-decoration: none; font-size: 10px; margin: 0;"
>
<video controls style="width: 100%; margin: 0;">
<source src="https://player.vimeo.com/progressive_redirect/playback/1191885020/rendition/240p/file.mp4%20%28240p%29.mp4?loc=external&oauth2_token_id=1223210874&signature=7475cd53e0dd33ac90cc762653bacb60d4ed58e1785050f0c9e33ba65a8429f6" type="video/mp4"
poster="https://thumbs.wbm.im/pw/medium/ddd5b05d2e3d53fe679c3e9d08a08fc6.jpg"/>
Your browser does not support the video tag.
</video>
<p style="font-size: 12px; margin: 0;">PikWizard</p>
</a>
</span>
</span>
Free (free of charge)
Free for personal and commercial use.
Author: Awesome Content