
- Home >
- Stock Videos >
- Colorful Data Visualization Graph on Binary Background
Colorful Data Visualization Graph on Binary Background Video
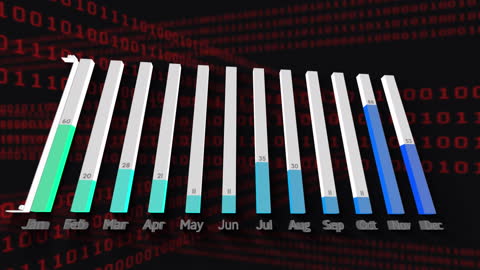
Vibrant data visualization features a series of colorful 3D bars representing monthly statistics, set against an animated background of binary code. Ideal for illustrating trends in data analysis, projections in technology reports, or concept pieces on digital advancements. Useful for editorial features, business presentations, and technology magazines.

downloads
Tags:
More
Credit Photo
If you would like to credit the Photo, here are some ways you can do so
Text Link
video Link
<span class="text-link">
<span>
<a target="_blank" href=https://pikwizard.com/video/colorful-data-visualization-graph-on-binary-background/12500bb33a3d77992df21df9003426c3/>PikWizard</a>
</span>
</span>
<span class="image-link">
<span
style="margin: 0 0 20px 0; display: inline-block; vertical-align: middle; width: 100%;"
>
<a
target="_blank"
href="https://pikwizard.com/video/colorful-data-visualization-graph-on-binary-background/12500bb33a3d77992df21df9003426c3/"
style="text-decoration: none; font-size: 10px; margin: 0;"
>
<video controls style="width: 100%; margin: 0;">
<source src="https://player.vimeo.com/progressive_redirect/playback/722090499/rendition/240p/file.mp4?loc=external&oauth2_token_id=1223210874&signature=68fca51e6977637b13962382b2195b6f416f4496426388df8dd640f1296633a2" type="video/mp4"
poster="https://pikwizard.com/pw/medium/12500bb33a3d77992df21df9003426c3.jpg"/>
Your browser does not support the video tag.
</video>
<p style="font-size: 12px; margin: 0;">PikWizard</p>
</a>
</span>
</span>
Free (free of charge)
Free for personal and commercial use.
Author: Awesome Content