
- Home >
- Stock Videos >
- Colorful Digital Bar Graph Representing Economic Trends
Colorful Digital Bar Graph Representing Economic Trends Video
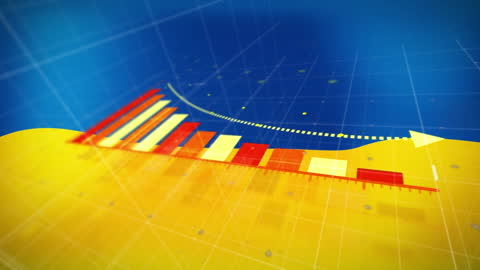
Colorful digital bar graph represents economic trends and growth. Can be used for presentations on economic forecasts, business strategy, or technology innovations. Suitable for educational resources or business analytical reports focusing on market data and predictive analysis.
Powered by 


0
downloads
downloads
Tags:
More
Credit Photo
If you would like to credit the Photo, here are some ways you can do so
Text Link
video Link
<span class="text-link">
<span>
<a target="_blank" href=https://pikwizard.com/video/colorful-digital-bar-graph-representing-economic-trends/1448d1ec71c49ad56dedeb0b1433ea10/>PikWizard</a>
</span>
</span>
<span class="image-link">
<span
style="margin: 0 0 20px 0; display: inline-block; vertical-align: middle; width: 100%;"
>
<a
target="_blank"
href="https://pikwizard.com/video/colorful-digital-bar-graph-representing-economic-trends/1448d1ec71c49ad56dedeb0b1433ea10/"
style="text-decoration: none; font-size: 10px; margin: 0;"
>
<video controls style="width: 100%; margin: 0;">
<source src="https://player.vimeo.com/progressive_redirect/playback/838185983/rendition/240p/file.mp4?loc=external&oauth2_token_id=1223210874&signature=3cd6b8fa174029aab606ac33bbd266bb25673d161ddeefc2f632e08980a755e1" type="video/mp4"
poster="https://pikwizard.com/pw/medium/1448d1ec71c49ad56dedeb0b1433ea10.jpg"/>
Your browser does not support the video tag.
</video>
<p style="font-size: 12px; margin: 0;">PikWizard</p>
</a>
</span>
</span>
Free (free of charge)
Free for personal and commercial use.
Author: Awesome Content