
- Home >
- Stock Videos >
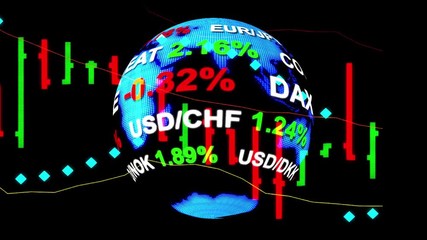
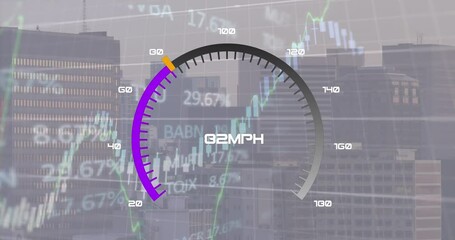
- Combined Speedometer over Financial Graphs and Trading Boards
Combined Speedometer over Financial Graphs and Trading Boards Video
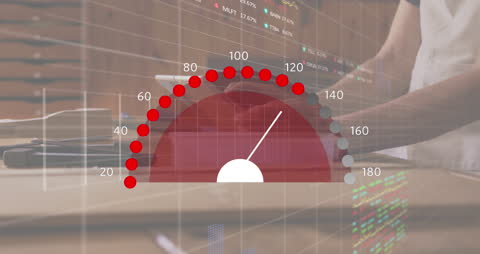
Visualizes financial metrics and data analytics; suitable for finance websites and presentations, emphasizing performance monitoring and business strategy planning. Ideal graphic for illustrating concepts related to economic indicators, market progress, and digital solutions interplay.
Powered by 


0
downloads
downloads
Tags:
More
Credit Photo
If you would like to credit the Photo, here are some ways you can do so
Text Link
video Link
<span class="text-link">
<span>
<a target="_blank" href=https://pikwizard.com/video/combined-speedometer-over-financial-graphs-and-trading-boards/fd5d3670c76b5f16e296684ea6db6b74/>PikWizard</a>
</span>
</span>
<span class="image-link">
<span
style="margin: 0 0 20px 0; display: inline-block; vertical-align: middle; width: 100%;"
>
<a
target="_blank"
href="https://pikwizard.com/video/combined-speedometer-over-financial-graphs-and-trading-boards/fd5d3670c76b5f16e296684ea6db6b74/"
style="text-decoration: none; font-size: 10px; margin: 0;"
>
<video controls style="width: 100%; margin: 0;">
<source src="https://player.vimeo.com/progressive_redirect/playback/907548516/rendition/240p/file.mp4?loc=external&oauth2_token_id=1223210874&signature=5b0f6979462a31955aa293618c8914905cc8244a764c8669b461f7dd380fcbed" type="video/mp4"
poster="https://pikwizard.com/pw/medium/fd5d3670c76b5f16e296684ea6db6b74.jpg"/>
Your browser does not support the video tag.
</video>
<p style="font-size: 12px; margin: 0;">PikWizard</p>
</a>
</span>
</span>
Free (free of charge)
Free for personal and commercial use.
Author: Awesome Content