
- Home >
- Stock Videos >
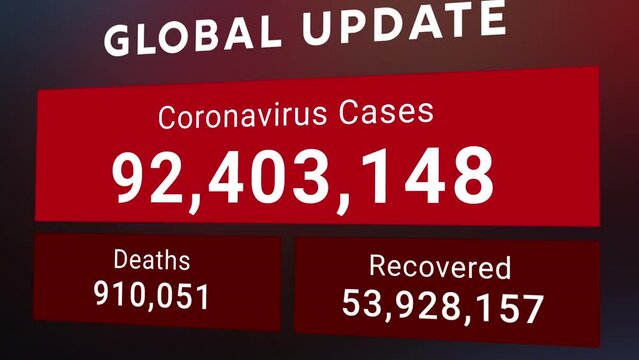
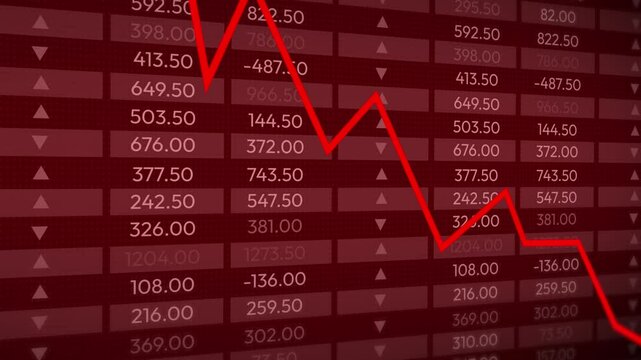
- Covid-19 Statistics Animation with Student and Molecular Model
Covid-19 Statistics Animation with Student and Molecular Model Video
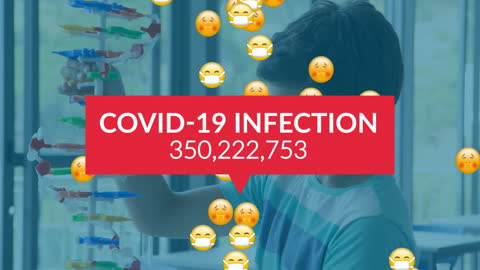
Digitally generated visual merges COVID-19 statistics with education videory. Icons showing emotions intersperse with statistic numbers addressing global infection impact. Useful for content on public health awareness, pandemic education, statistical illustrations in classroom settings, or engaging digital fist practices.
Powered by 


1
downloads
downloads
Tags:
More
Credit Photo
If you would like to credit the Photo, here are some ways you can do so
Text Link
video Link
<span class="text-link">
<span>
<a target="_blank" href=https://pikwizard.com/video/covid-19-statistics-animation-with-student-and-molecular-model/6bff62a696cdaec4dbabda02f0bf06b5/>PikWizard</a>
</span>
</span>
<span class="image-link">
<span
style="margin: 0 0 20px 0; display: inline-block; vertical-align: middle; width: 100%;"
>
<a
target="_blank"
href="https://pikwizard.com/video/covid-19-statistics-animation-with-student-and-molecular-model/6bff62a696cdaec4dbabda02f0bf06b5/"
style="text-decoration: none; font-size: 10px; margin: 0;"
>
<video controls style="width: 100%; margin: 0;">
<source src="https://player.vimeo.com/progressive_redirect/playback/716866040/rendition/240p/file.mp4?loc=external&oauth2_token_id=1223210874&signature=8ef830291ede5ea0b8a80ae158b25ec198f81f4ce77c5f001d4e4cdaa2d96d06" type="video/mp4"
poster="https://pikwizard.com/pw/medium/6bff62a696cdaec4dbabda02f0bf06b5.jpg"/>
Your browser does not support the video tag.
</video>
<p style="font-size: 12px; margin: 0;">PikWizard</p>
</a>
</span>
</span>
Free (free of charge)
Free for personal and commercial use.
Author: Awesome Content