
- Home >
- Stock Videos >
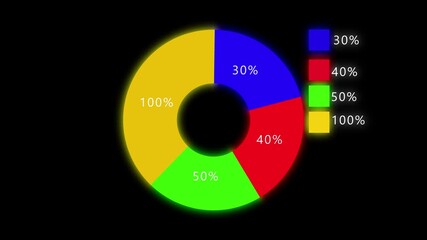
- Creative Data Analysis Concept with Infographics and Pouring Images
Creative Data Analysis Concept with Infographics and Pouring Images Video

Visual showcasing a creative overlay of infographics, representing innovative approaches to data visualization and financial analytics. The video creatively combines elements of data graphs with liquid pouring, suggesting fluidity and dynamic insights in business contexts. Useful for presentations on financial management, digital journalism, and insight generation highlighting unique perspectives in data presentation.
Powered by 


0
downloads
downloads
Tags:
More
Credit Photo
If you would like to credit the Photo, here are some ways you can do so
Text Link
video Link
<span class="text-link">
<span>
<a target="_blank" href=https://pikwizard.com/video/creative-data-analysis-concept-with-infographics-and-pouring-images/ddff8b357361a3b6e2640b3a71d835fd/>PikWizard</a>
</span>
</span>
<span class="image-link">
<span
style="margin: 0 0 20px 0; display: inline-block; vertical-align: middle; width: 100%;"
>
<a
target="_blank"
href="https://pikwizard.com/video/creative-data-analysis-concept-with-infographics-and-pouring-images/ddff8b357361a3b6e2640b3a71d835fd/"
style="text-decoration: none; font-size: 10px; margin: 0;"
>
<video controls style="width: 100%; margin: 0;">
<source src="https://player.vimeo.com/progressive_redirect/playback/760057855/rendition/240p/file.mp4?loc=external&oauth2_token_id=1223210874&signature=408f1def6df9ff16a9292fde9920a06df5a5166548ed9c28adf2210c32c60119" type="video/mp4"
poster="https://pikwizard.com/pw/medium/ddff8b357361a3b6e2640b3a71d835fd.jpg"/>
Your browser does not support the video tag.
</video>
<p style="font-size: 12px; margin: 0;">PikWizard</p>
</a>
</span>
</span>
Free (free of charge)
Free for personal and commercial use.
Author: Awesome Content
Similar Free Stock Videos
Loading...