
- Home >
- Stock Videos >
- Data Analysis and Visualization in Warehouse Management
Data Analysis and Visualization in Warehouse Management Video
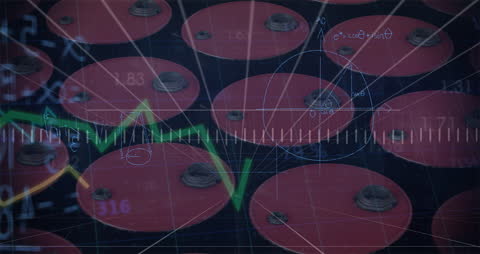
Animated digital graphs are shown over large red barrels used for storage and transportation, conveying themes of global logistics and inventory management. This can be used for illustrating advanced data analytics in logistics settings and modern supply chain solutions enhancements driven by smart technology.

downloads
Tags:
More
Credit Photo
If you would like to credit the Photo, here are some ways you can do so
Text Link
video Link
<span class="text-link">
<span>
<a target="_blank" href=https://pikwizard.com/video/data-analysis-and-visualization-in-warehouse-management/c1241338a40c1237d75d7fde0061d9d6/>PikWizard</a>
</span>
</span>
<span class="image-link">
<span
style="margin: 0 0 20px 0; display: inline-block; vertical-align: middle; width: 100%;"
>
<a
target="_blank"
href="https://pikwizard.com/video/data-analysis-and-visualization-in-warehouse-management/c1241338a40c1237d75d7fde0061d9d6/"
style="text-decoration: none; font-size: 10px; margin: 0;"
>
<video controls style="width: 100%; margin: 0;">
<source src="https://player.vimeo.com/progressive_redirect/playback/743627521/rendition/240p/file.mp4?loc=external&oauth2_token_id=1223210874&signature=87a50d610f6ffc82e510a92a15f950ddc14d1e1b36be0236f1f354ca6ad9df71" type="video/mp4"
poster="https://pikwizard.com/pw/medium/c1241338a40c1237d75d7fde0061d9d6.jpg"/>
Your browser does not support the video tag.
</video>
<p style="font-size: 12px; margin: 0;">PikWizard</p>
</a>
</span>
</span>
Free (free of charge)
Free for personal and commercial use.
Author: Awesome Content