
- Home >
- Stock Videos >
- Data Analysis with Covid-19 Visualization on World Map
Data Analysis with Covid-19 Visualization on World Map Video
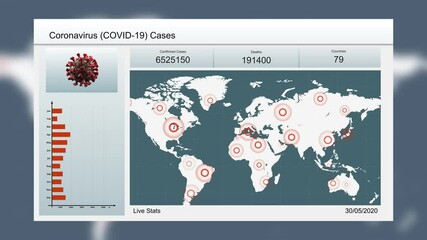
A composite illustration showing statistical data laid over a world map with Covid-19 cells in the background. This visualization conceptually represents the analysis and monitoring of pandemic data across different regions. Useful for topics related to health tracking, global surveillance tools, technology in healthcare, and data science pioneering solutions for pandemics.
Powered by 


downloads
Tags:
More
Credit Photo
If you would like to credit the Photo, here are some ways you can do so
Text Link
video Link
<span class="text-link">
<span>
<a target="_blank" href=https://pikwizard.com/video/data-analysis-with-covid-19-visualization-on-world-map/c8a5d8b787aa634cdd836116a1786a65/>PikWizard</a>
</span>
</span>
<span class="image-link">
<span
style="margin: 0 0 20px 0; display: inline-block; vertical-align: middle; width: 100%;"
>
<a
target="_blank"
href="https://pikwizard.com/video/data-analysis-with-covid-19-visualization-on-world-map/c8a5d8b787aa634cdd836116a1786a65/"
style="text-decoration: none; font-size: 10px; margin: 0;"
>
<video controls style="width: 100%; margin: 0;">
<source src="https://player.vimeo.com/progressive_redirect/playback/775027263/rendition/240p/file.mp4?loc=external&oauth2_token_id=1223210874&signature=70433ad259093d0878310fbe4a4dd444aa80abbf18a13d5737ce9c79da3a9c81" type="video/mp4"
poster="https://pikwizard.com/pw/medium/c8a5d8b787aa634cdd836116a1786a65.jpg"/>
Your browser does not support the video tag.
</video>
<p style="font-size: 12px; margin: 0;">PikWizard</p>
</a>
</span>
</span>
Free (free of charge)
Free for personal and commercial use.
Author: Awesome Content