
- Home >
- Stock Videos >
- Data Analytics Dashboard Visualizing Global Trends
Data Analytics Dashboard Visualizing Global Trends Video
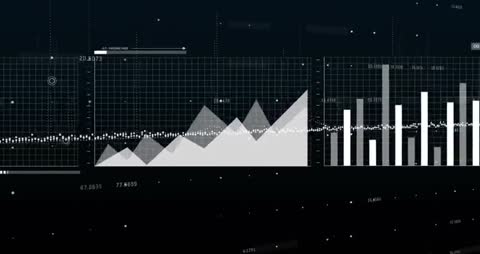
This scene presents an advanced data analytics dashboard with dynamic charts and graphs. Showing peaks and baselines while animating multiple data presentations, it effectively visualizes global trends. It is ideal for illustrating technology concepts, information analysis, and digital tool functionality. Suitable for use in presentations, tech articles, or educational materials focused on big data and analytics.

downloads
Tags:
More
Credit Photo
If you would like to credit the Photo, here are some ways you can do so
Text Link
video Link
<span class="text-link">
<span>
<a target="_blank" href=https://pikwizard.com/video/data-analytics-dashboard-visualizing-global-trends/4b61e21ab4ea80c5c2ff38672184956f/>PikWizard</a>
</span>
</span>
<span class="image-link">
<span
style="margin: 0 0 20px 0; display: inline-block; vertical-align: middle; width: 100%;"
>
<a
target="_blank"
href="https://pikwizard.com/video/data-analytics-dashboard-visualizing-global-trends/4b61e21ab4ea80c5c2ff38672184956f/"
style="text-decoration: none; font-size: 10px; margin: 0;"
>
<video controls style="width: 100%; margin: 0;">
<source src="https://player.vimeo.com/progressive_redirect/playback/1119143411/rendition/240p/file.mp4?loc=external&oauth2_token_id=1223210874&signature=de821b67631714996de3a8fd6e9c211065e2e674939df9df5e8113b44842861a" type="video/mp4"
poster="https://pikwizard.com/pw/medium/4b61e21ab4ea80c5c2ff38672184956f.jpg"/>
Your browser does not support the video tag.
</video>
<p style="font-size: 12px; margin: 0;">PikWizard</p>
</a>
</span>
</span>
Free (free of charge)
Free for personal and commercial use.
Author: Awesome Content