
- Home >
- Stock Videos >
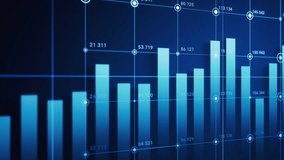
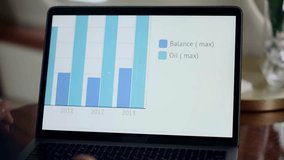
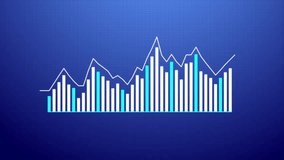
- Data Analytics Visualization with Bar Graph Overlapping Futuristic Theme
Data Analytics Visualization with Bar Graph Overlapping Futuristic Theme Video
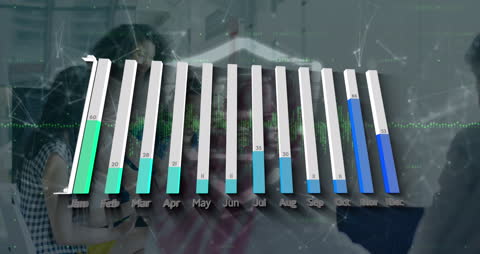
Bright bar graph overlapping futuristic background represents dynamic data analytics. Useful for technology presentations, financial seminars, or educational resources.
Powered by  - Get 15% off with code: PIKWIZARD15


downloads
Tags:
More
Credit Photo
If you would like to credit the Photo, here are some ways you can do so
Text Link
video Link
<span class="text-link">
<span>
<a target="_blank" href=https://pikwizard.com/video/data-analytics-visualization-with-bar-graph-overlapping-futuristic-theme/76dc262ea76f154cb5dd5b950d6b29a7/>PikWizard</a>
</span>
</span>
<span class="image-link">
<span
style="margin: 0 0 20px 0; display: inline-block; vertical-align: middle; width: 100%;"
>
<a
target="_blank"
href="https://pikwizard.com/video/data-analytics-visualization-with-bar-graph-overlapping-futuristic-theme/76dc262ea76f154cb5dd5b950d6b29a7/"
style="text-decoration: none; font-size: 10px; margin: 0;"
>
<video controls style="width: 100%; margin: 0;">
<source src="https://player.vimeo.com/progressive_redirect/playback/717753370/rendition/240p/file.mp4?loc=external&oauth2_token_id=1223210874&signature=0e72bdeb8967201692f2c2f73d8d86adc66642f962ab7afd28de4ea483ebea9d" type="video/mp4"
poster="https://pikwizard.com/pw/medium/76dc262ea76f154cb5dd5b950d6b29a7.jpg"/>
Your browser does not support the video tag.
</video>
<p style="font-size: 12px; margin: 0;">PikWizard</p>
</a>
</span>
</span>
Free (free of charge)
Free for personal and commercial use.
Author: Awesome Content