
- Home >
- Stock Videos >
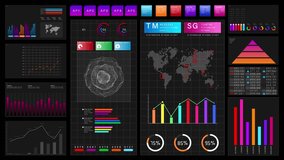
- Data Analytics Visualization with Vibrant Concentric Patterns
Data Analytics Visualization with Vibrant Concentric Patterns Video

Abstract illustration depicting data analysis enhanced with bright orange concentric circles overlapping digital graphs. Useful for illustrating modern data analytics, business reports, presentations, and technology-oriented topics. The dynamic and colorful design emphasizes progress and innovation.
Powered by  - Get 15% off with code: PIKWIZARD15


downloads
Tags:
More
Credit Photo
If you would like to credit the Photo, here are some ways you can do so
Text Link
video Link
<span class="text-link">
<span>
<a target="_blank" href=https://pikwizard.com/video/data-analytics-visualization-with-vibrant-concentric-patterns/70d913aca6ebaac648bd2677e488e0e7/>PikWizard</a>
</span>
</span>
<span class="image-link">
<span
style="margin: 0 0 20px 0; display: inline-block; vertical-align: middle; width: 100%;"
>
<a
target="_blank"
href="https://pikwizard.com/video/data-analytics-visualization-with-vibrant-concentric-patterns/70d913aca6ebaac648bd2677e488e0e7/"
style="text-decoration: none; font-size: 10px; margin: 0;"
>
<video controls style="width: 100%; margin: 0;">
<source src="https://player.vimeo.com/progressive_redirect/playback/829687821/rendition/240p/file.mp4?loc=external&oauth2_token_id=1223210874&signature=86557d843a3bee073b60207ff142a4337b56b61799670cb1a4aeef4374f92cc4" type="video/mp4"
poster="https://pikwizard.com/pw/medium/70d913aca6ebaac648bd2677e488e0e7.jpg"/>
Your browser does not support the video tag.
</video>
<p style="font-size: 12px; margin: 0;">PikWizard</p>
</a>
</span>
</span>
Free (free of charge)
Free for personal and commercial use.
Author: Awesome Content