
- Home >
- Stock Videos >
- Data Analytics with Erratic Graph Against Glass Office Building
Data Analytics with Erratic Graph Against Glass Office Building Video
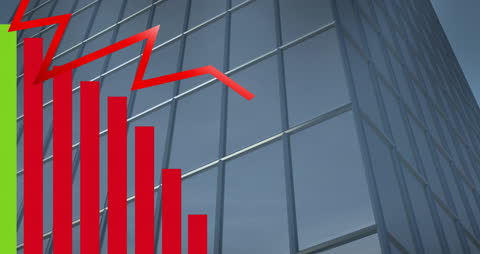
Abstract representation of data analysis shown through red trends on a graph with glass office building reflecting modern corporate environment. Ideal for corporate presentations, finance sectors, economic reviews, and educational material illustrating business data trends.
Powered by 


downloads
Tags:
More
Credit Photo
If you would like to credit the Photo, here are some ways you can do so
Text Link
video Link
<span class="text-link">
<span>
<a target="_blank" href=https://pikwizard.com/video/data-analytics-with-erratic-graph-against-glass-office-building/230deff0f800cfdcdf1193597957af53/>PikWizard</a>
</span>
</span>
<span class="image-link">
<span
style="margin: 0 0 20px 0; display: inline-block; vertical-align: middle; width: 100%;"
>
<a
target="_blank"
href="https://pikwizard.com/video/data-analytics-with-erratic-graph-against-glass-office-building/230deff0f800cfdcdf1193597957af53/"
style="text-decoration: none; font-size: 10px; margin: 0;"
>
<video controls style="width: 100%; margin: 0;">
<source src="https://player.vimeo.com/progressive_redirect/playback/736167769/rendition/540p/file.mp4?loc=external&oauth2_token_id=1223210874&signature=e99660aa9c68d795fe5e49343701174fff354c190b23dfe1bba709421b57d2ac" type="video/mp4"
poster="https://pikwizard.com/pw/medium/230deff0f800cfdcdf1193597957af53.jpg"/>
Your browser does not support the video tag.
</video>
<p style="font-size: 12px; margin: 0;">PikWizard</p>
</a>
</span>
</span>
Free (free of charge)
Free for personal and commercial use.
Author: Awesome Content