
- Home >
- Stock Videos >
- Data Distributions and Server Graphics with Bar Chart Overlay
Data Distributions and Server Graphics with Bar Chart Overlay Video
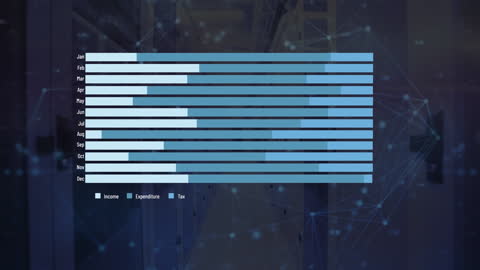
The visual shows a bar chart displaying monthly data including income, expenditure, and tax with a backdrop of servers and digital connections. Useful for illustrating topics related to technology, financial analysis, data-driven decisions, and global economic trends in presentations and reports.
Powered by 


downloads
Tags:
More
Credit Photo
If you would like to credit the Photo, here are some ways you can do so
Text Link
video Link
<span class="text-link">
<span>
<a target="_blank" href=https://pikwizard.com/video/data-distributions-and-server-graphics-with-bar-chart-overlay/da1bf3afa925f69b22494e7fca2715a5/>PikWizard</a>
</span>
</span>
<span class="image-link">
<span
style="margin: 0 0 20px 0; display: inline-block; vertical-align: middle; width: 100%;"
>
<a
target="_blank"
href="https://pikwizard.com/video/data-distributions-and-server-graphics-with-bar-chart-overlay/da1bf3afa925f69b22494e7fca2715a5/"
style="text-decoration: none; font-size: 10px; margin: 0;"
>
<video controls style="width: 100%; margin: 0;">
<source src="https://player.vimeo.com/progressive_redirect/playback/728203926/rendition/240p/file.mp4?loc=external&oauth2_token_id=1223210874&signature=9b58c5d0bd2f0437cf1153236bb6f8ffa46db114fbe7b6dc2c7e207ec2666b30" type="video/mp4"
poster="https://pikwizard.com/pw/medium/da1bf3afa925f69b22494e7fca2715a5.jpg"/>
Your browser does not support the video tag.
</video>
<p style="font-size: 12px; margin: 0;">PikWizard</p>
</a>
</span>
</span>
Free (free of charge)
Free for personal and commercial use.
Author: Awesome Content