
- Home >
- Stock Videos >
- Data Processing Animation on Dark Grid Background
Data Processing Animation on Dark Grid Background Video
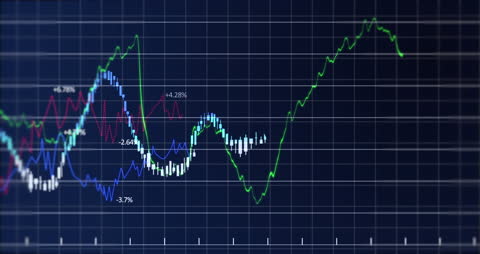
Visualization of dynamic line graphs on a dark grid represents data analysis and trending concepts. Useful for illustrating financial growth, market researchers, or presentations in data sciences. Effective in technology themes and digital analytics discussion.

downloads
Tags:
More
Credit Photo
If you would like to credit the Photo, here are some ways you can do so
Text Link
video Link
<span class="text-link">
<span>
<a target="_blank" href=https://pikwizard.com/video/data-processing-animation-on-dark-grid-background/b210d74179358cb1008de56f80551a58/>PikWizard</a>
</span>
</span>
<span class="image-link">
<span
style="margin: 0 0 20px 0; display: inline-block; vertical-align: middle; width: 100%;"
>
<a
target="_blank"
href="https://pikwizard.com/video/data-processing-animation-on-dark-grid-background/b210d74179358cb1008de56f80551a58/"
style="text-decoration: none; font-size: 10px; margin: 0;"
>
<video controls style="width: 100%; margin: 0;">
<source src="https://player.vimeo.com/progressive_redirect/playback/718916224/rendition/240p/file.mp4?loc=external&oauth2_token_id=1223210874&signature=f6534449588284c898ee46692f87eb471811206a746c77dc0f041315af66e213" type="video/mp4"
poster="https://pikwizard.com/pw/medium/b210d74179358cb1008de56f80551a58.jpg"/>
Your browser does not support the video tag.
</video>
<p style="font-size: 12px; margin: 0;">PikWizard</p>
</a>
</span>
</span>
Free (free of charge)
Free for personal and commercial use.
Author: Awesome Content