
- Home >
- Stock Videos >
- Data Processing Bar Chart Animation with Monthly Breakdown
Data Processing Bar Chart Animation with Monthly Breakdown Video
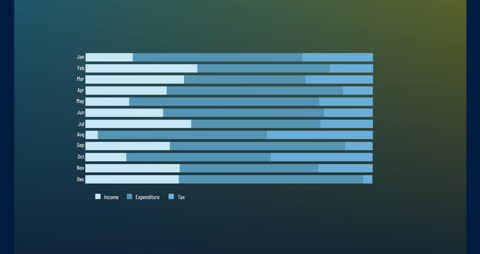
This dynamic bar chart animation illustrates the distribution of income, expenditure, and tax over each month. The visual presentation is ideal for financial reports, economic studies, and business presentations, providing a clear and engaging way to digest extensive data. Useful in technological campaigns highlighting online security and data management solutions.

downloads
Tags:
More
Credit Photo
If you would like to credit the Photo, here are some ways you can do so
Text Link
video Link
<span class="text-link">
<span>
<a target="_blank" href=https://pikwizard.com/video/data-processing-bar-chart-animation-with-monthly-breakdown/c129d4bb38c496d13add03c4c662bfd5/>PikWizard</a>
</span>
</span>
<span class="image-link">
<span
style="margin: 0 0 20px 0; display: inline-block; vertical-align: middle; width: 100%;"
>
<a
target="_blank"
href="https://pikwizard.com/video/data-processing-bar-chart-animation-with-monthly-breakdown/c129d4bb38c496d13add03c4c662bfd5/"
style="text-decoration: none; font-size: 10px; margin: 0;"
>
<video controls style="width: 100%; margin: 0;">
<source src="https://player.vimeo.com/progressive_redirect/playback/908850633/rendition/240p/file.mp4?loc=external&oauth2_token_id=1223210874&signature=a9cd014048ecbc50b70226e651d096ad79fc929957860e148da79cd917405781" type="video/mp4"
poster="https://pikwizard.com/pw/medium/c129d4bb38c496d13add03c4c662bfd5.jpg"/>
Your browser does not support the video tag.
</video>
<p style="font-size: 12px; margin: 0;">PikWizard</p>
</a>
</span>
</span>
Free (free of charge)
Free for personal and commercial use.
Author: Awesome Content