
- Home >
- Stock Videos >
- Data Visualization Overlay on Junkyard Scene
Data Visualization Overlay on Junkyard Scene Video
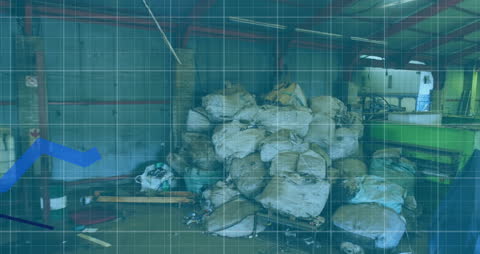
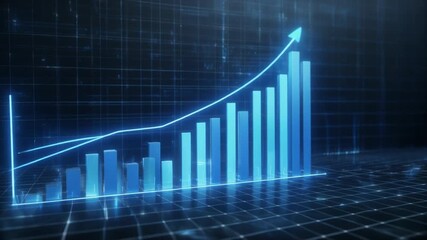
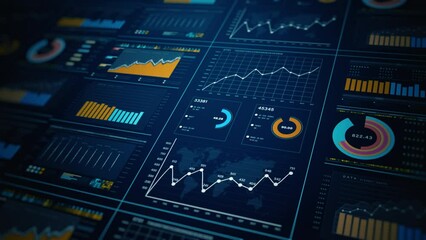
Combination of financial data and graphs superimposed on a junkyard setting. Symbols of sustainability, pointing out both challenges and opportunities in finance and waste management. Useful for presentations on economic impact of recycling, educational content about sustainability, or market analysis in environmental solutions.
Powered by 


downloads
Credit Photo
If you would like to credit the Photo, here are some ways you can do so
Text Link
video Link
<span class="text-link">
<span>
<a target="_blank" href=https://pikwizard.com/video/data-visualization-overlay-on-junkyard-scene/99761b5bb78f4ce10620f97945ee6731/>PikWizard</a>
</span>
</span>
<span class="image-link">
<span
style="margin: 0 0 20px 0; display: inline-block; vertical-align: middle; width: 100%;"
>
<a
target="_blank"
href="https://pikwizard.com/video/data-visualization-overlay-on-junkyard-scene/99761b5bb78f4ce10620f97945ee6731/"
style="text-decoration: none; font-size: 10px; margin: 0;"
>
<video controls style="width: 100%; margin: 0;">
<source src="https://player.vimeo.com/progressive_redirect/playback/717214074/rendition/240p/file.mp4?loc=external&oauth2_token_id=1223210874&signature=0c6dbb8f073da4ab05bef29b07f1515609042f1ce9e5302a53a9fdd193f6f16d" type="video/mp4"
poster="https://pikwizard.com/pw/medium/99761b5bb78f4ce10620f97945ee6731.jpg"/>
Your browser does not support the video tag.
</video>
<p style="font-size: 12px; margin: 0;">PikWizard</p>
</a>
</span>
</span>
Free (free of charge)
Free for personal and commercial use.
Author: Awesome Content