
- Home >
- Stock Videos >
- Data Visualization with Growing Red Bar Graph and Upward Arrow Trend
Data Visualization with Growing Red Bar Graph and Upward Arrow Trend Video
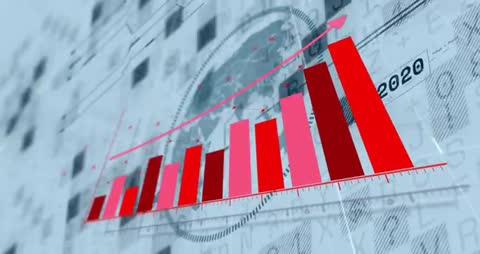
A dynamic visual depicting a red bar graph illustrating growth and a sharp upward line arrow indicating rising trends. Perfect for presentations or content related to data analytics, business intelligence, market analysis, or futuristic technology to illustrate progress and financial growth.
Powered by 


downloads
Tags:
More
Credit Photo
If you would like to credit the Photo, here are some ways you can do so
Text Link
video Link
<span class="text-link">
<span>
<a target="_blank" href=https://pikwizard.com/video/data-visualization-with-growing-red-bar-graph-and-upward-arrow-trend/39fe185cfc2ea896bf79c66e9db03693/>PikWizard</a>
</span>
</span>
<span class="image-link">
<span
style="margin: 0 0 20px 0; display: inline-block; vertical-align: middle; width: 100%;"
>
<a
target="_blank"
href="https://pikwizard.com/video/data-visualization-with-growing-red-bar-graph-and-upward-arrow-trend/39fe185cfc2ea896bf79c66e9db03693/"
style="text-decoration: none; font-size: 10px; margin: 0;"
>
<video controls style="width: 100%; margin: 0;">
<source src="https://player.vimeo.com/progressive_redirect/playback/1113149161/rendition/240p/file.mp4?loc=external&oauth2_token_id=1223210874&signature=c2aa7ce2e7ca71ba7ad2f5a1d43e1c5bb0387f9793616005f7a5c47ed59ed869" type="video/mp4"
poster="https://pikwizard.com/pw/medium/39fe185cfc2ea896bf79c66e9db03693.jpg"/>
Your browser does not support the video tag.
</video>
<p style="font-size: 12px; margin: 0;">PikWizard</p>
</a>
</span>
</span>
Free (free of charge)
Free for personal and commercial use.
Author: Awesome Content