
- Home >
- Stock Videos >
- Data Visualization with Statistical Graph Overlay
Data Visualization with Statistical Graph Overlay Video
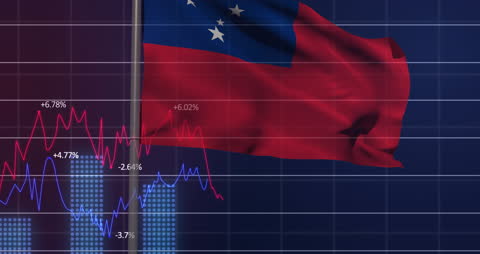
Scene captures essence of global business finance through overlaying graphs and statistics on a colorful national flag backdrop. Represents economic trends, market analysis, and financial data interpretation ideal for media on global economics, financial presentations, and educational tutorials about data analytics and world markets.
Powered by  - Get 15% off with code: PIKWIZARD15


downloads
Tags:
More
Credit Photo
If you would like to credit the Photo, here are some ways you can do so
Text Link
video Link
<span class="text-link">
<span>
<a target="_blank" href=https://pikwizard.com/video/data-visualization-with-statistical-graph-overlay/0dcb2d3f26c39f988d249af24a6fde20/>PikWizard</a>
</span>
</span>
<span class="image-link">
<span
style="margin: 0 0 20px 0; display: inline-block; vertical-align: middle; width: 100%;"
>
<a
target="_blank"
href="https://pikwizard.com/video/data-visualization-with-statistical-graph-overlay/0dcb2d3f26c39f988d249af24a6fde20/"
style="text-decoration: none; font-size: 10px; margin: 0;"
>
<video controls style="width: 100%; margin: 0;">
<source src="https://player.vimeo.com/progressive_redirect/playback/759661537/rendition/240p/file.mp4?loc=external&oauth2_token_id=1223210874&signature=75582ff96204b695f7ac227edc5624a18a5fcc08b20ad7f921cdce57a85de803" type="video/mp4"
poster="https://pikwizard.com/pw/medium/0dcb2d3f26c39f988d249af24a6fde20.jpg"/>
Your browser does not support the video tag.
</video>
<p style="font-size: 12px; margin: 0;">PikWizard</p>
</a>
</span>
</span>
Free (free of charge)
Free for personal and commercial use.
Author: Awesome Content