
- Home >
- Stock Videos >
- Dice Overlay on Data with Intersecting Market Trends
Dice Overlay on Data with Intersecting Market Trends Video
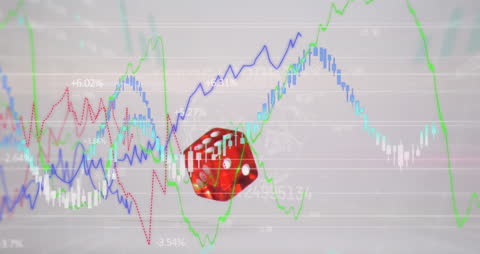
Conceptual videory illustrating the unpredictable nature of stock and financial markets. Background features overlapping graphs and charts symbolizing complex market trends. Superimposed dice suggest elements of chance and risk involved in investment strategies. Useful for presentations, financial forecasts, blog articles about market predictions, economics, and investment strategies.
Powered by 


0
downloads
downloads
Tags:
More
Credit Photo
If you would like to credit the Photo, here are some ways you can do so
Text Link
video Link
<span class="text-link">
<span>
<a target="_blank" href=https://pikwizard.com/video/dice-overlay-on-data-with-intersecting-market-trends/921085ad751863b0e9fd8263d39677ba/>PikWizard</a>
</span>
</span>
<span class="image-link">
<span
style="margin: 0 0 20px 0; display: inline-block; vertical-align: middle; width: 100%;"
>
<a
target="_blank"
href="https://pikwizard.com/video/dice-overlay-on-data-with-intersecting-market-trends/921085ad751863b0e9fd8263d39677ba/"
style="text-decoration: none; font-size: 10px; margin: 0;"
>
<video controls style="width: 100%; margin: 0;">
<source src="https://player.vimeo.com/progressive_redirect/playback/755214217/rendition/240p/file.mp4?loc=external&oauth2_token_id=1223210874&signature=90fd28b47ada7560f7d745281f35401215443b158398620ae08bac76d5509726" type="video/mp4"
poster="https://pikwizard.com/pw/medium/921085ad751863b0e9fd8263d39677ba.jpg"/>
Your browser does not support the video tag.
</video>
<p style="font-size: 12px; margin: 0;">PikWizard</p>
</a>
</span>
</span>
Free (free of charge)
Free for personal and commercial use.
Author: Awesome Content