
- Home >
- Stock Videos >
- Digital Analytics Dashboard with Monthly Data Chart
Digital Analytics Dashboard with Monthly Data Chart Video
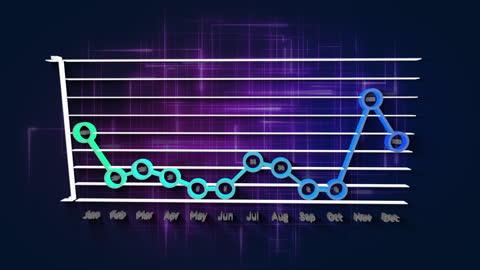
This video showcases a digital dashboard containing a line chart depicting monthly statistics. It presents data in a vibrant graphical format with purple light effects, ideal for illustrating analytical tasks in business, technology, and computer sciences contexts. Perfect for use in reports, presentations, business slideshows, or web design to emphasize modern and dynamic data analysis.

downloads
Tags:
More
Credit Photo
If you would like to credit the Photo, here are some ways you can do so
Text Link
video Link
<span class="text-link">
<span>
<a target="_blank" href=https://pikwizard.com/video/digital-analytics-dashboard-with-monthly-data-chart/25cc3dfcfc8c482d1646dc88b1eb5a6d/>PikWizard</a>
</span>
</span>
<span class="image-link">
<span
style="margin: 0 0 20px 0; display: inline-block; vertical-align: middle; width: 100%;"
>
<a
target="_blank"
href="https://pikwizard.com/video/digital-analytics-dashboard-with-monthly-data-chart/25cc3dfcfc8c482d1646dc88b1eb5a6d/"
style="text-decoration: none; font-size: 10px; margin: 0;"
>
<video controls style="width: 100%; margin: 0;">
<source src="https://player.vimeo.com/progressive_redirect/playback/736588935/rendition/240p/file.mp4?loc=external&oauth2_token_id=1223210874&signature=00abb2e4a8ab1c6ff5bceedfe004a5f12db22d7501a7cc99161f57bd67b13e1d" type="video/mp4"
poster="https://pikwizard.com/pw/medium/25cc3dfcfc8c482d1646dc88b1eb5a6d.jpg"/>
Your browser does not support the video tag.
</video>
<p style="font-size: 12px; margin: 0;">PikWizard</p>
</a>
</span>
</span>
Free (free of charge)
Free for personal and commercial use.
Author: Awesome Content