
- Home >
- Stock Videos >
- Digital Analytics Overlay with Data Visualization Effect
Digital Analytics Overlay with Data Visualization Effect Video
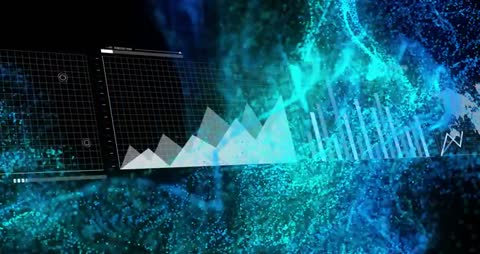
Triangular chart floating over a dynamic particle visualization in neon blues and greens symbolizes cutting-edge technology. This scene is ideal for illustrating concepts of digital analytics, tech innovation, or futuristic interfaces. Useful for presentations, technology blogs, and advertisements focusing on visual data representation or digital transformation.
Powered by  - Get 15% off with code: PIKWIZARD15


downloads
Tags:
More
Credit Photo
If you would like to credit the Photo, here are some ways you can do so
Text Link
video Link
<span class="text-link">
<span>
<a target="_blank" href=https://pikwizard.com/video/digital-analytics-overlay-with-data-visualization-effect/a1559f468eb192357a3319ba8091fe65/>PikWizard</a>
</span>
</span>
<span class="image-link">
<span
style="margin: 0 0 20px 0; display: inline-block; vertical-align: middle; width: 100%;"
>
<a
target="_blank"
href="https://pikwizard.com/video/digital-analytics-overlay-with-data-visualization-effect/a1559f468eb192357a3319ba8091fe65/"
style="text-decoration: none; font-size: 10px; margin: 0;"
>
<video controls style="width: 100%; margin: 0;">
<source src="https://player.vimeo.com/progressive_redirect/playback/1084939599/rendition/240p/file.mp4?loc=external&oauth2_token_id=1223210874&signature=19d4f85902dab370b3461adb0e93fed858c38d494b49a79f5586ae86f7f1d8c4" type="video/mp4"
poster="https://pikwizard.com/pw/medium/a1559f468eb192357a3319ba8091fe65.jpg"/>
Your browser does not support the video tag.
</video>
<p style="font-size: 12px; margin: 0;">PikWizard</p>
</a>
</span>
</span>
Free (free of charge)
Free for personal and commercial use.
Author: Awesome Content