
- Home >
- Stock Videos >
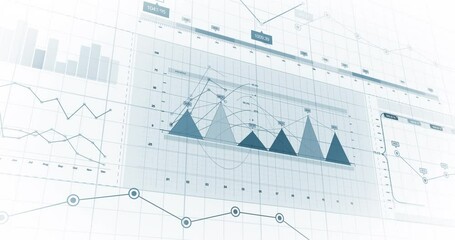
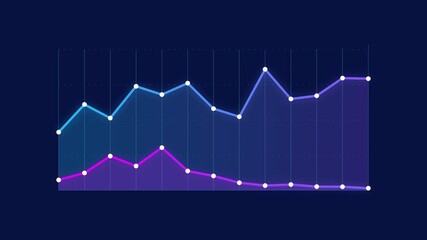
- Digital Animation of Financial Data with Graphs
Digital Animation of Financial Data with Graphs Video
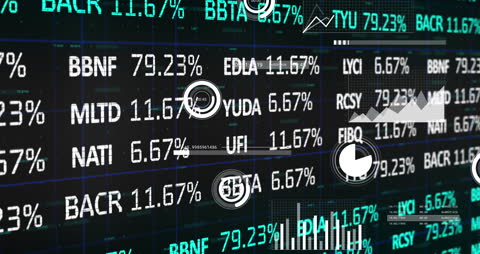
This displays an animation of financial data and graphs. Charts show fluctuations and percentages, indicating financial metrics and stock market trends. Ideal for presentations on finance, technology in trading, economic guides, or data visualization tutorials.
Powered by 


downloads
Tags:
More
Credit Photo
If you would like to credit the Photo, here are some ways you can do so
Text Link
video Link
<span class="text-link">
<span>
<a target="_blank" href=https://pikwizard.com/video/digital-animation-of-financial-data-with-graphs/38c0cac9f404d52bf24b355b56e634f4/>PikWizard</a>
</span>
</span>
<span class="image-link">
<span
style="margin: 0 0 20px 0; display: inline-block; vertical-align: middle; width: 100%;"
>
<a
target="_blank"
href="https://pikwizard.com/video/digital-animation-of-financial-data-with-graphs/38c0cac9f404d52bf24b355b56e634f4/"
style="text-decoration: none; font-size: 10px; margin: 0;"
>
<video controls style="width: 100%; margin: 0;">
<source src="https://player.vimeo.com/progressive_redirect/playback/760268280/rendition/240p/file.mp4?loc=external&oauth2_token_id=1223210874&signature=d4425a86ee089bf2c201d490fb23ce17805654652f530dc0a56249d56afa901f" type="video/mp4"
poster="https://pikwizard.com/pw/medium/38c0cac9f404d52bf24b355b56e634f4.jpg"/>
Your browser does not support the video tag.
</video>
<p style="font-size: 12px; margin: 0;">PikWizard</p>
</a>
</span>
</span>
Free (free of charge)
Free for personal and commercial use.
Author: Awesome Content
Similar Free Stock Videos
Loading...